
Confirm file format and reference conventions
OMX / 003 · Transcriptomics
OmicsVis — Differential Expression Explorer
Interactive exploration of differential gene expression and transcriptomic result tables.
SCIENTIFIC PURPOSE
Turns supported DEG and expression matrices into clear volcano plots, heatmaps and sample-level visual summaries for research communication.
Who it helps
- Transcriptomics researchers
- Cancer biology teams
- Pharmacology researchers
- Publication authors
Supported inputs
- DEG CSV with gene, fold-change and p-value fields
- Optional expression matrix
- Sample annotations where supported
Useful outputs
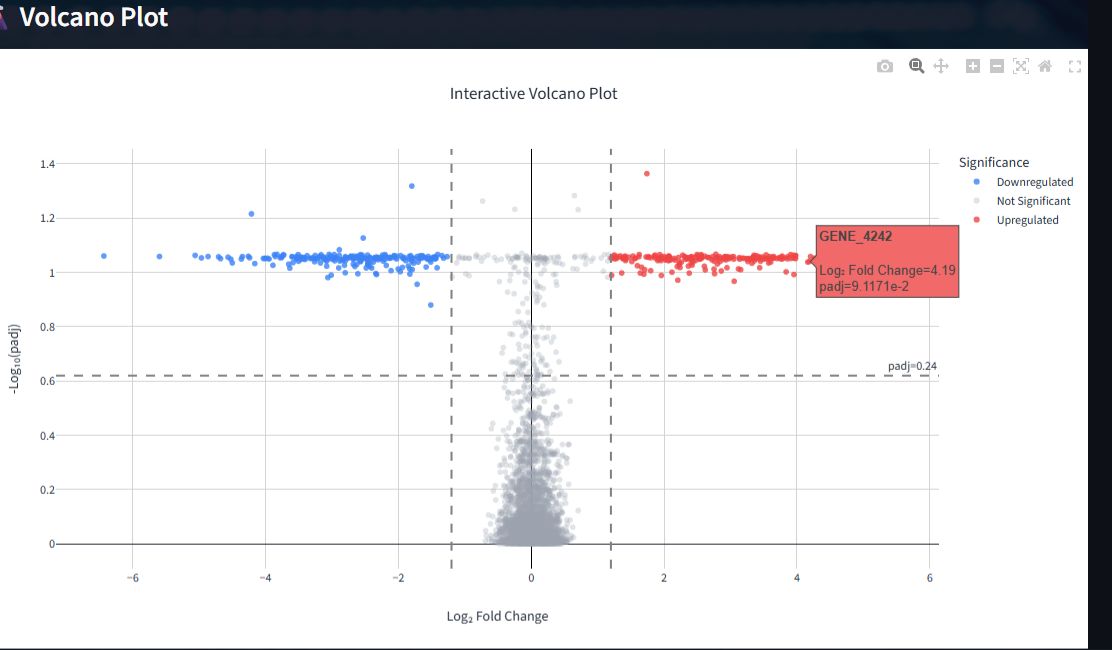
- Interactive volcano plot
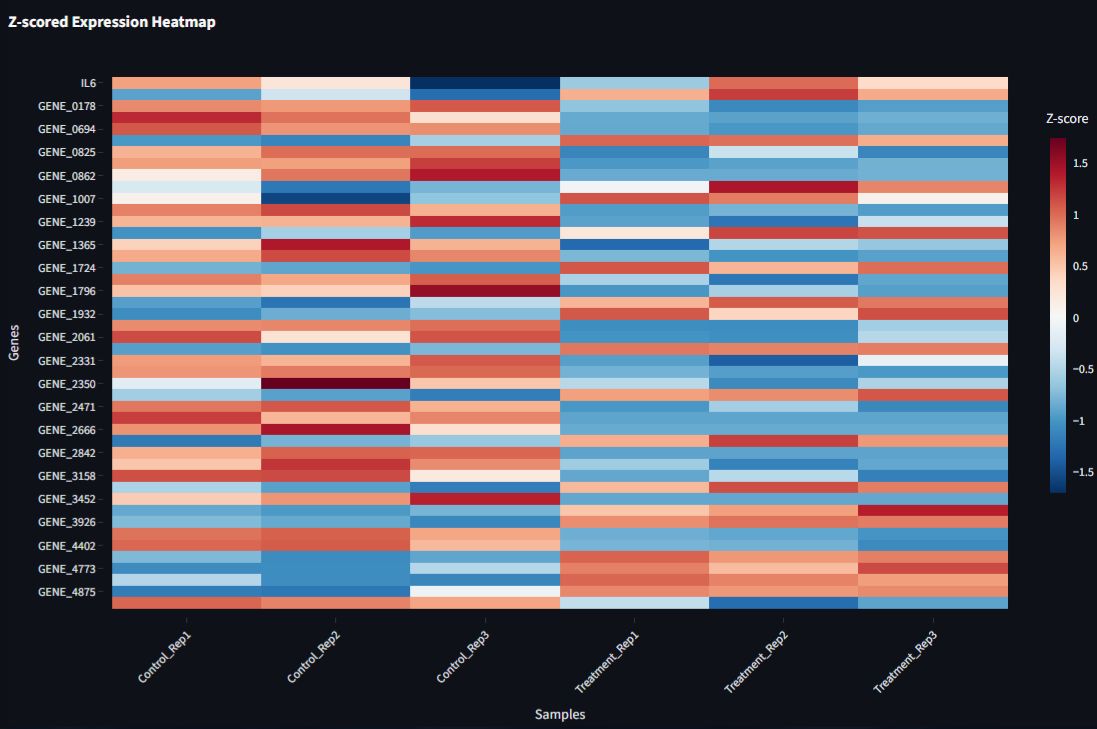
- Expression heatmap
- PCA or sample overview
- Publication-oriented export
PROJECT INTELLIGENCE
A structured view of
scope and evidence.
These figures describe the documented public surface—not biological performance, clinical validity or benchmark superiority.
OMX / 003Working demonstration
Differential-expression visualisationMultiple-testing-aware thresholdsExpression clusteringInteractive plottingDATA CONTRACT
What enters, what happens,
what leaves.
01 / INPUT
DEG CSV with gene, fold-change and p-value fields
Optional expression matrix
Sample annotations where supported
02 / ANALYSIS
01Load DEG results
02Validate required columns
03Set significance thresholds
04Inspect genes and patterns
05Export selected figures
03 / OUTPUT
Interactive volcano plot
Expression heatmap
PCA or sample overview
Publication-oriented export
EVIDENCE & INTERPRETATION MATRIX
How to use the project responsibly.
DimensionPublic evidenceInterpretation boundary
Interface2 documented viewsScreenshots demonstrate interaction patterns, not scientific validation.
MethodsDifferential-expression visualisation · Multiple-testing-aware thresholds · Expression clustering · Interactive plottingMethod presence does not establish suitability for every dataset.
ReproducibilityDefined inputs, stages and outputsVersions, parameters and data provenance must accompany a real analysis.
Scientific useResearch exploration and communicationNo medical, diagnostic or treatment conclusion is produced.
BEFORE INTERPRETATION
Record tool, database and dataset versions
Inspect missing values, outliers and sample labels
Review assumptions behind each selected method
Keep exported figures linked to their source data
Request domain-expert review for consequential claims
TYPICAL RESEARCH FLOW
- 01
Load DEG results
- 02
Validate required columns
- 03
Set significance thresholds
- 04
Inspect genes and patterns
- 05
Export selected figures
INTERFACE GALLERY
Multiple views,
one research task.
Project demonstration captures. Displayed material may be benchmark or demonstration data and is not clinical evidence.
METHODS REPRESENTED
Differential-expression visualisationMultiple-testing-aware thresholdsExpression clusteringInteractive plotting
KNOWN LIMITATIONS
- Does not perform raw-read alignment
- Statistical interpretation depends on upstream experimental design
- Demonstration visuals may use benchmark data
USEFUL QUESTIONS
Before using the output.
What columns are required?
A gene identifier, log2 fold change and an adjusted or raw p-value field are required for the main DEG view.
Can figures be used in publications?
The interface is designed for export, but authors remain responsible for statistical validation, labelling and journal requirements.