
Confirm file format and reference conventions
SCO / 004 · Single-cell biology
Single-Cell AI Explorer
Interactive exploration of annotated single-cell populations, UMAP coordinates and marker-gene results.
SCIENTIFIC PURPOSE
Helps computational biology teams inspect cell clusters, compare annotations and communicate cellular heterogeneity.
Who it helps
- Single-cell researchers
- Immunology teams
- Cancer microenvironment researchers
- Cell biology students
Supported inputs
- Cell metadata with UMAP coordinates
- Gene-expression table
- Optional marker table
Useful outputs
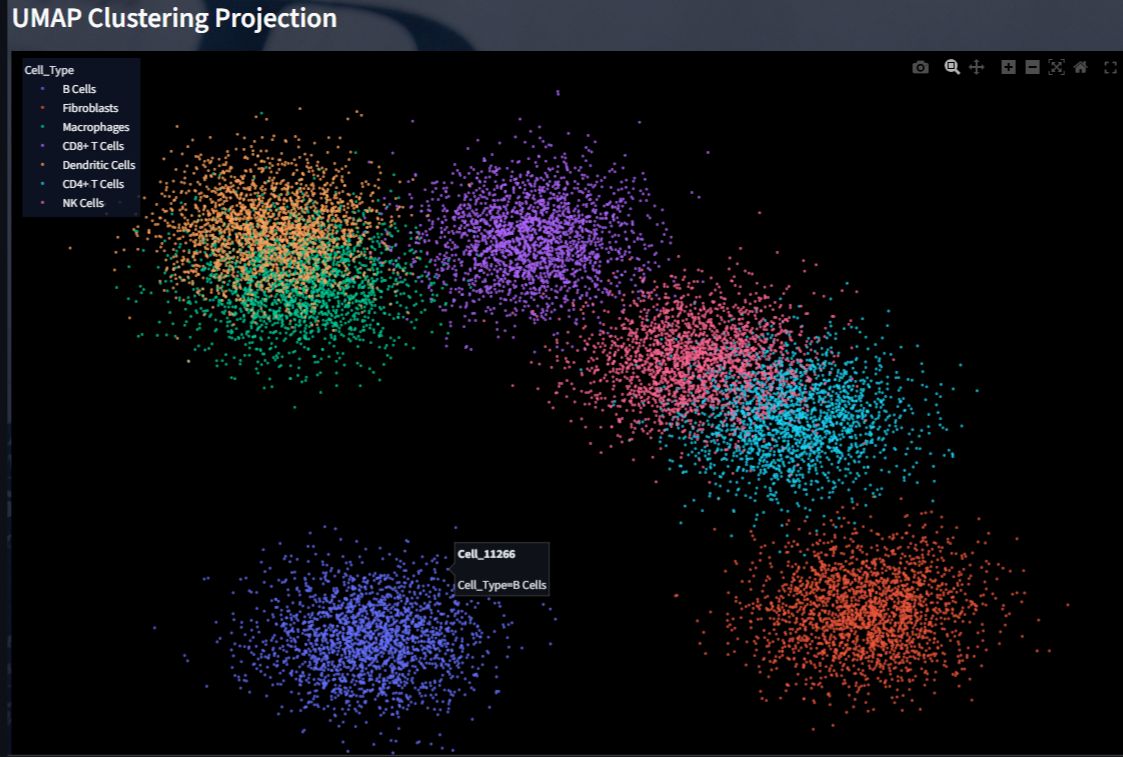
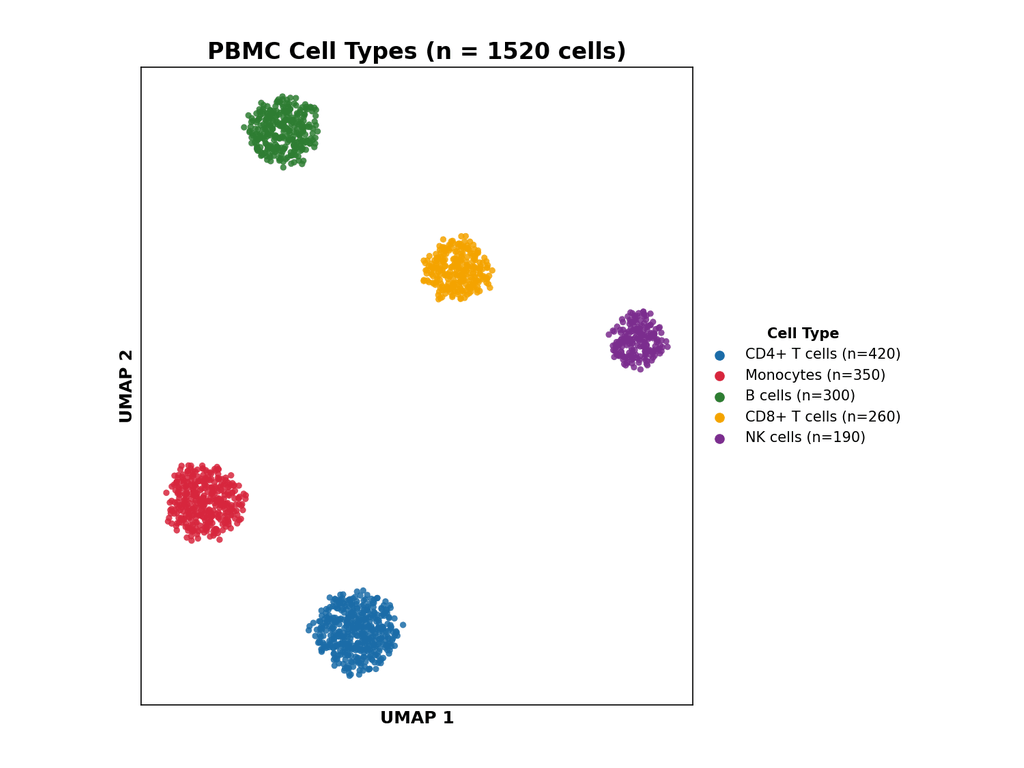
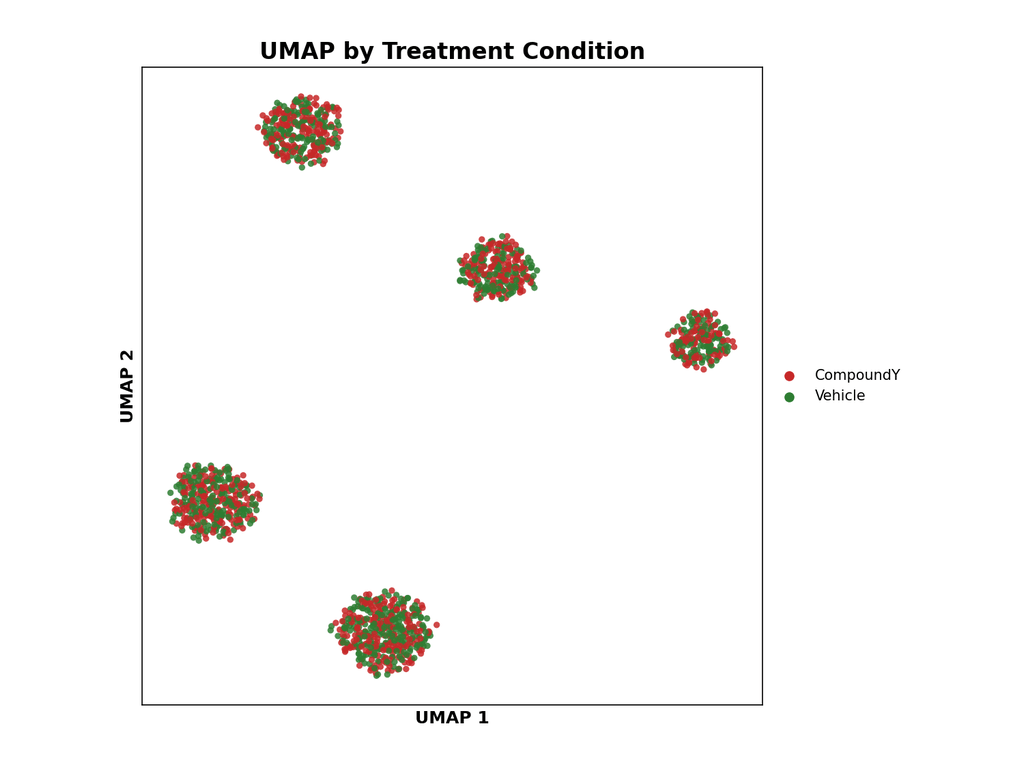
- Interactive UMAP
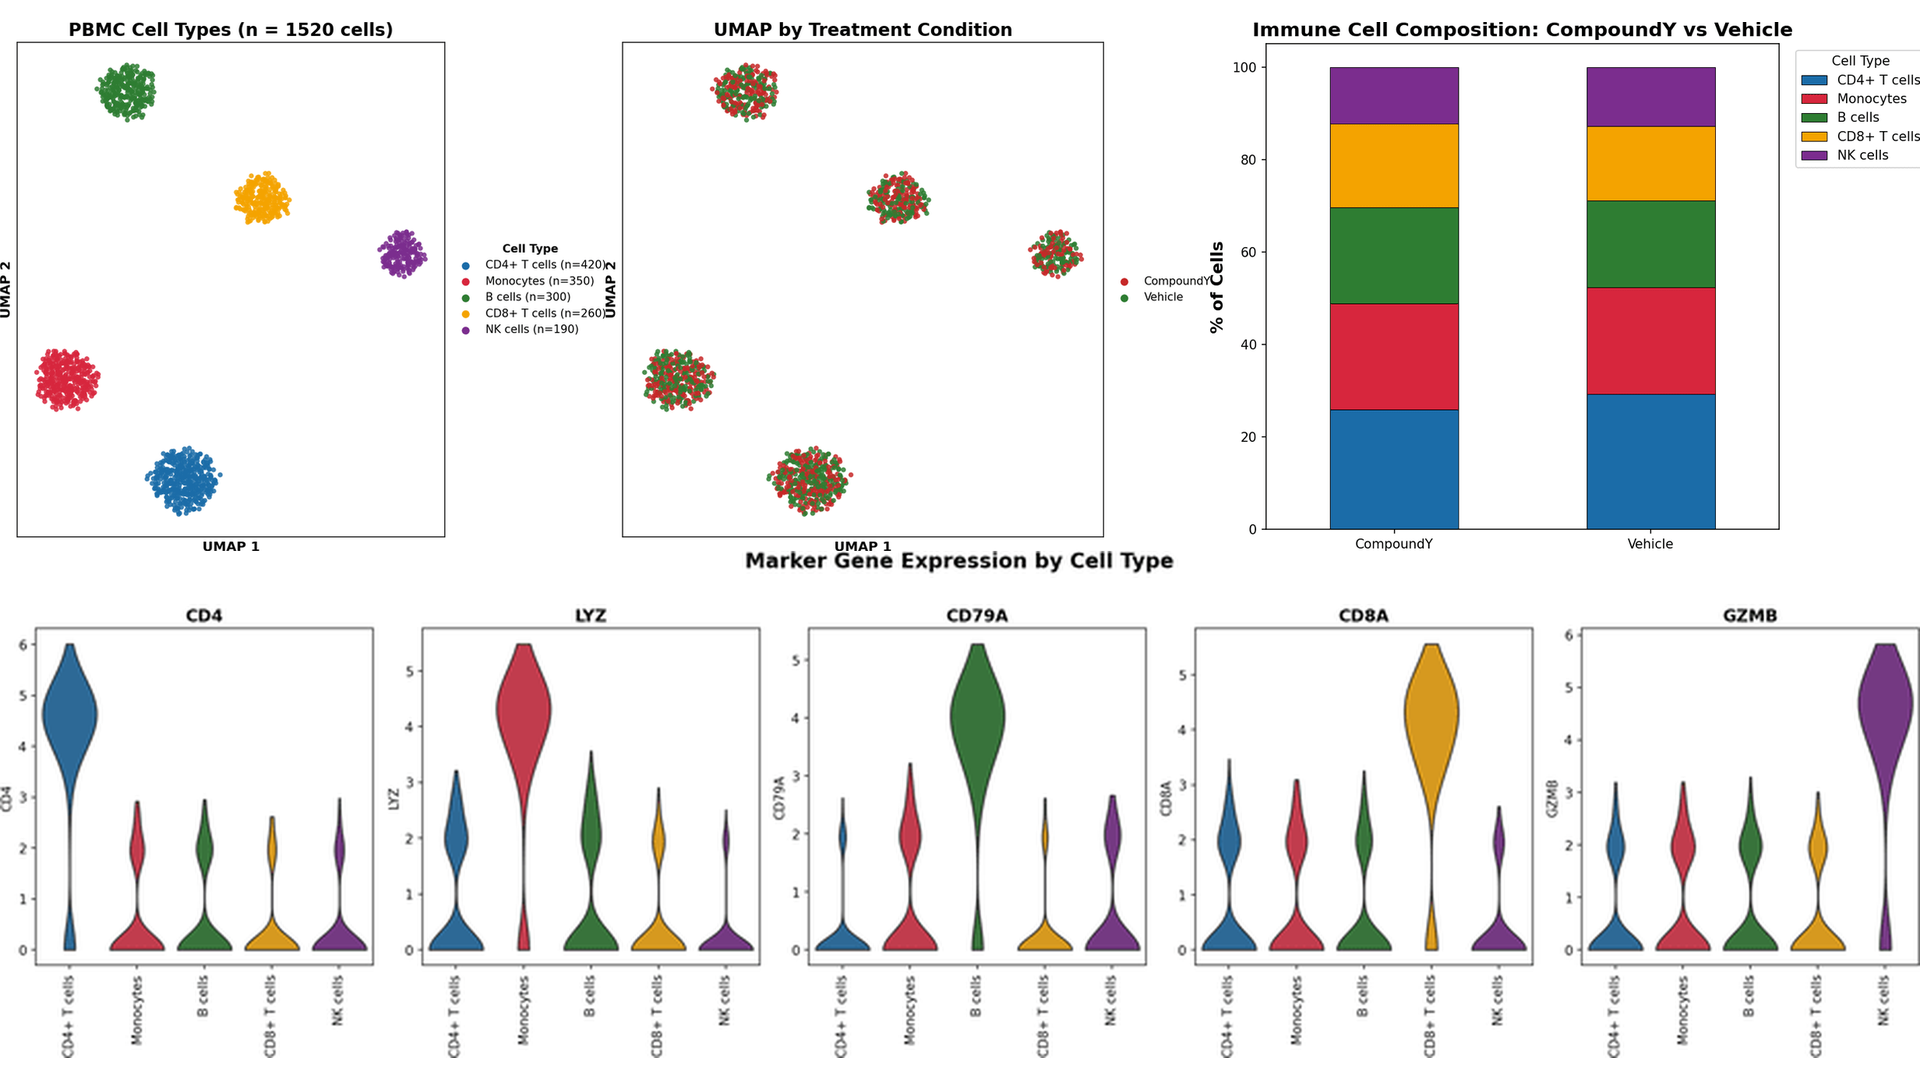
- Cell-type distribution
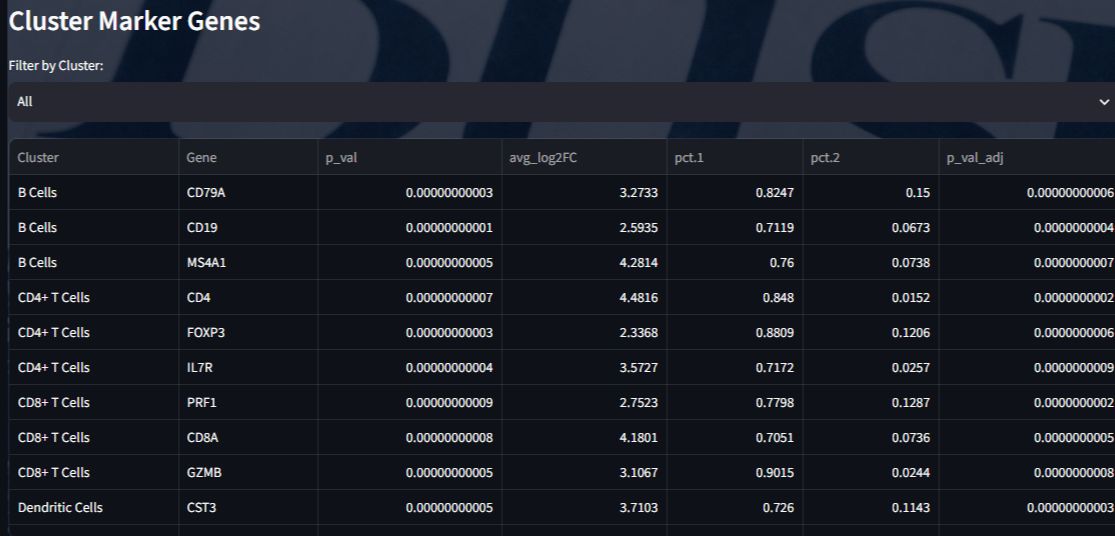
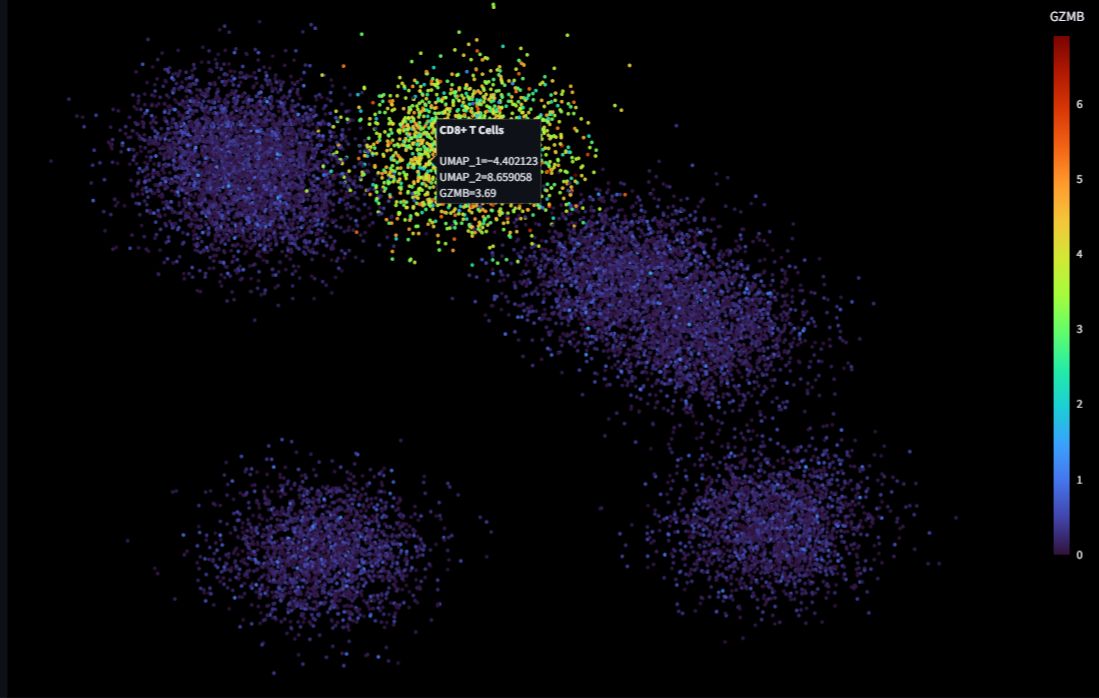
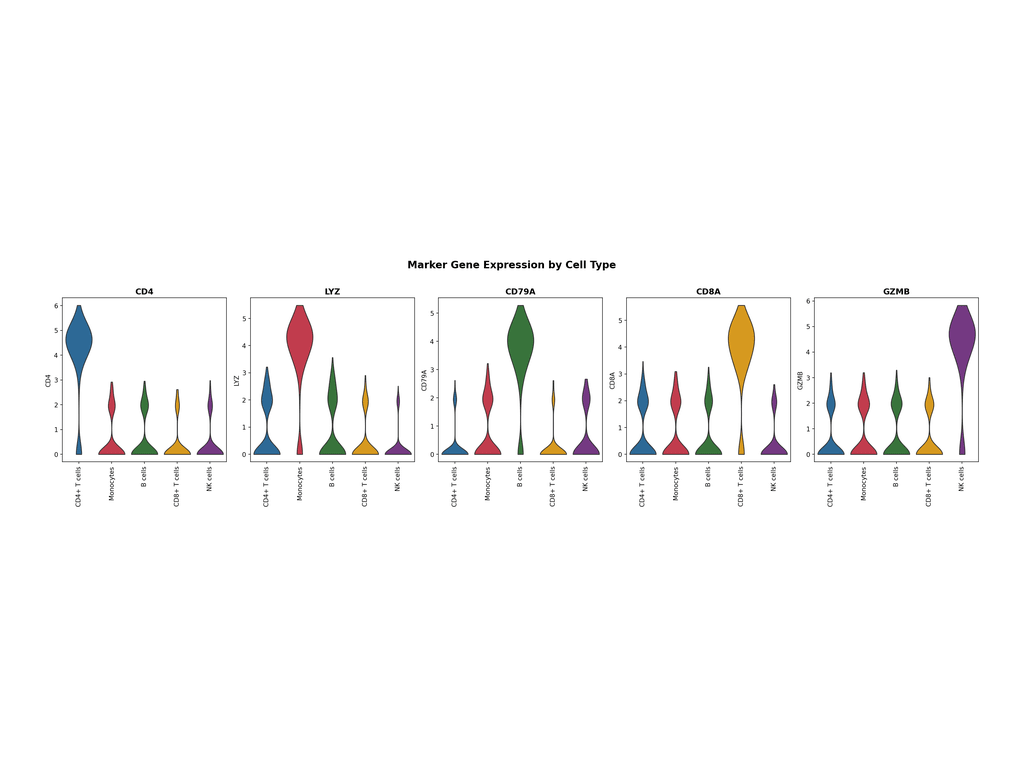
- Marker-gene views
- Cluster-oriented exports
PROJECT INTELLIGENCE
A structured view of
scope and evidence.
These figures describe the documented public surface—not biological performance, clinical validity or benchmark superiority.
SCO / 004Working demonstration
UMAP visualisationCluster annotation reviewMarker-gene explorationDATA CONTRACT
What enters, what happens,
what leaves.
01 / INPUT
Cell metadata with UMAP coordinates
Gene-expression table
Optional marker table
02 / ANALYSIS
01Load cell metadata
02Validate cell identifiers and coordinates
03Colour by annotation
04Inspect clusters and markers
05Export selected views
03 / OUTPUT
Interactive UMAP
Cell-type distribution
Marker-gene views
Cluster-oriented exports
EVIDENCE & INTERPRETATION MATRIX
How to use the project responsibly.
DimensionPublic evidenceInterpretation boundary
Interface11 documented viewsScreenshots demonstrate interaction patterns, not scientific validation.
MethodsUMAP visualisation · Cluster annotation review · Marker-gene explorationMethod presence does not establish suitability for every dataset.
ReproducibilityDefined inputs, stages and outputsVersions, parameters and data provenance must accompany a real analysis.
Scientific useResearch exploration and communicationNo medical, diagnostic or treatment conclusion is produced.
BEFORE INTERPRETATION
Record tool, database and dataset versions
Inspect missing values, outliers and sample labels
Review assumptions behind each selected method
Keep exported figures linked to their source data
Request domain-expert review for consequential claims
TYPICAL RESEARCH FLOW
- 01
Load cell metadata
- 02
Validate cell identifiers and coordinates
- 03
Colour by annotation
- 04
Inspect clusters and markers
- 05
Export selected views
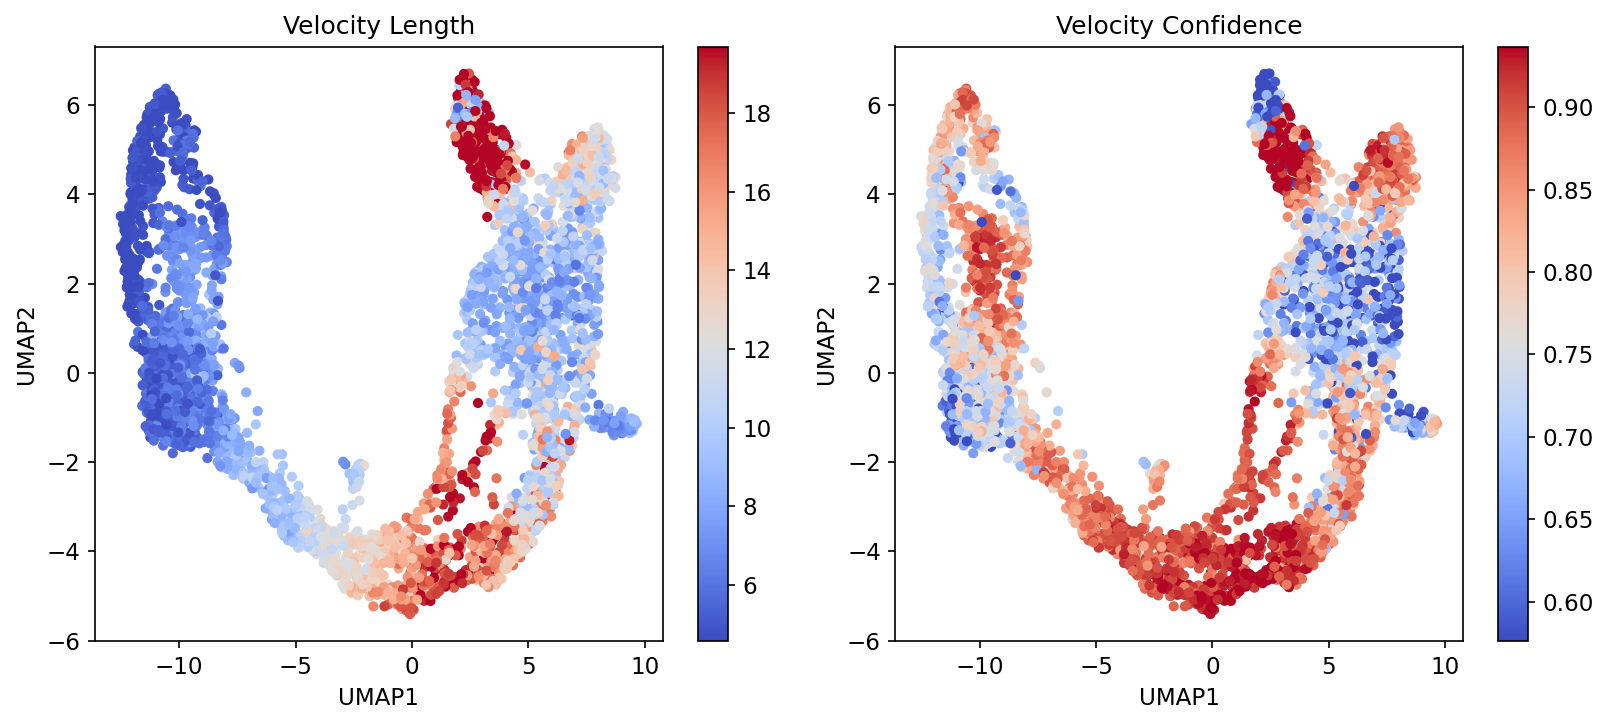
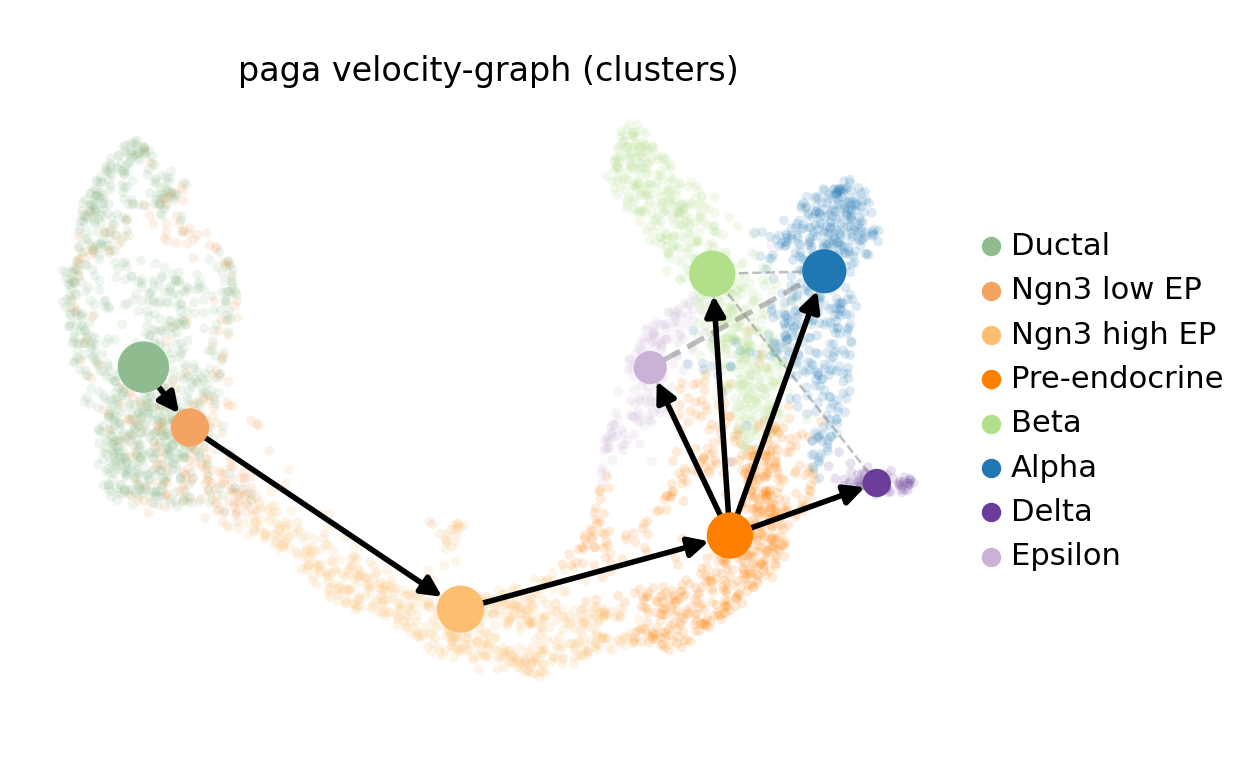
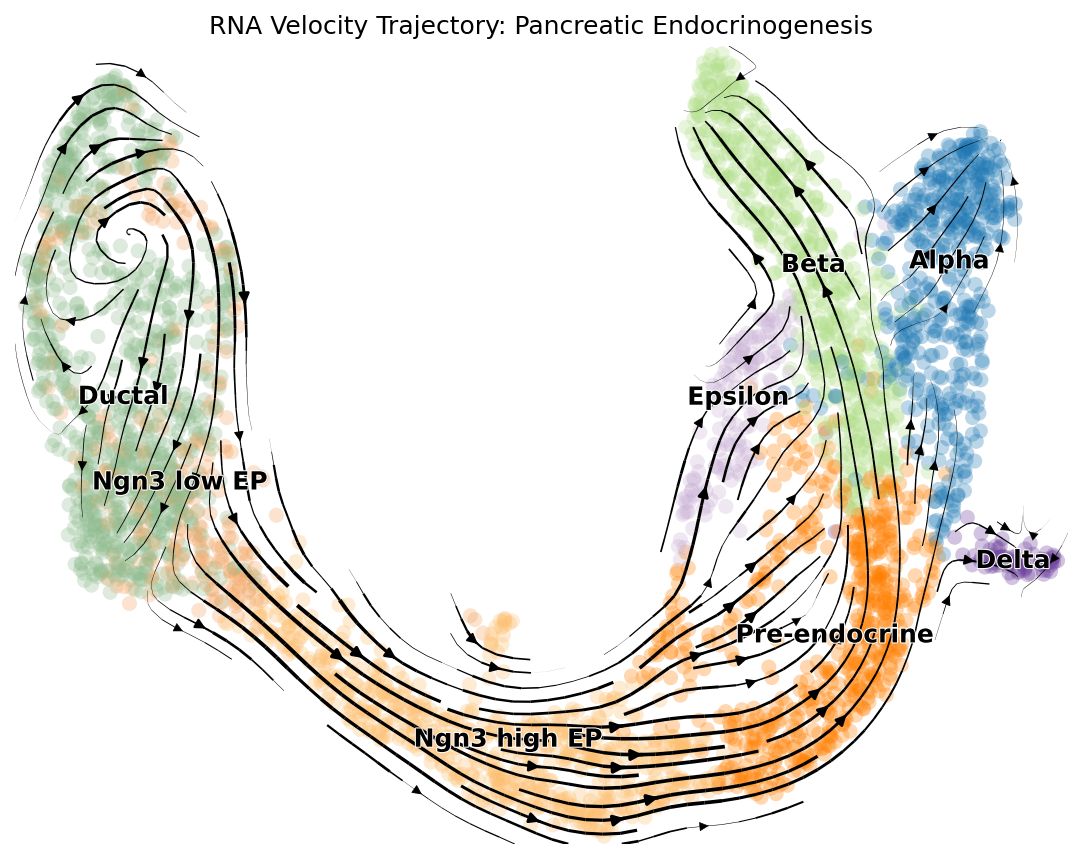
INTERFACE GALLERY
Multiple views,
one research task.
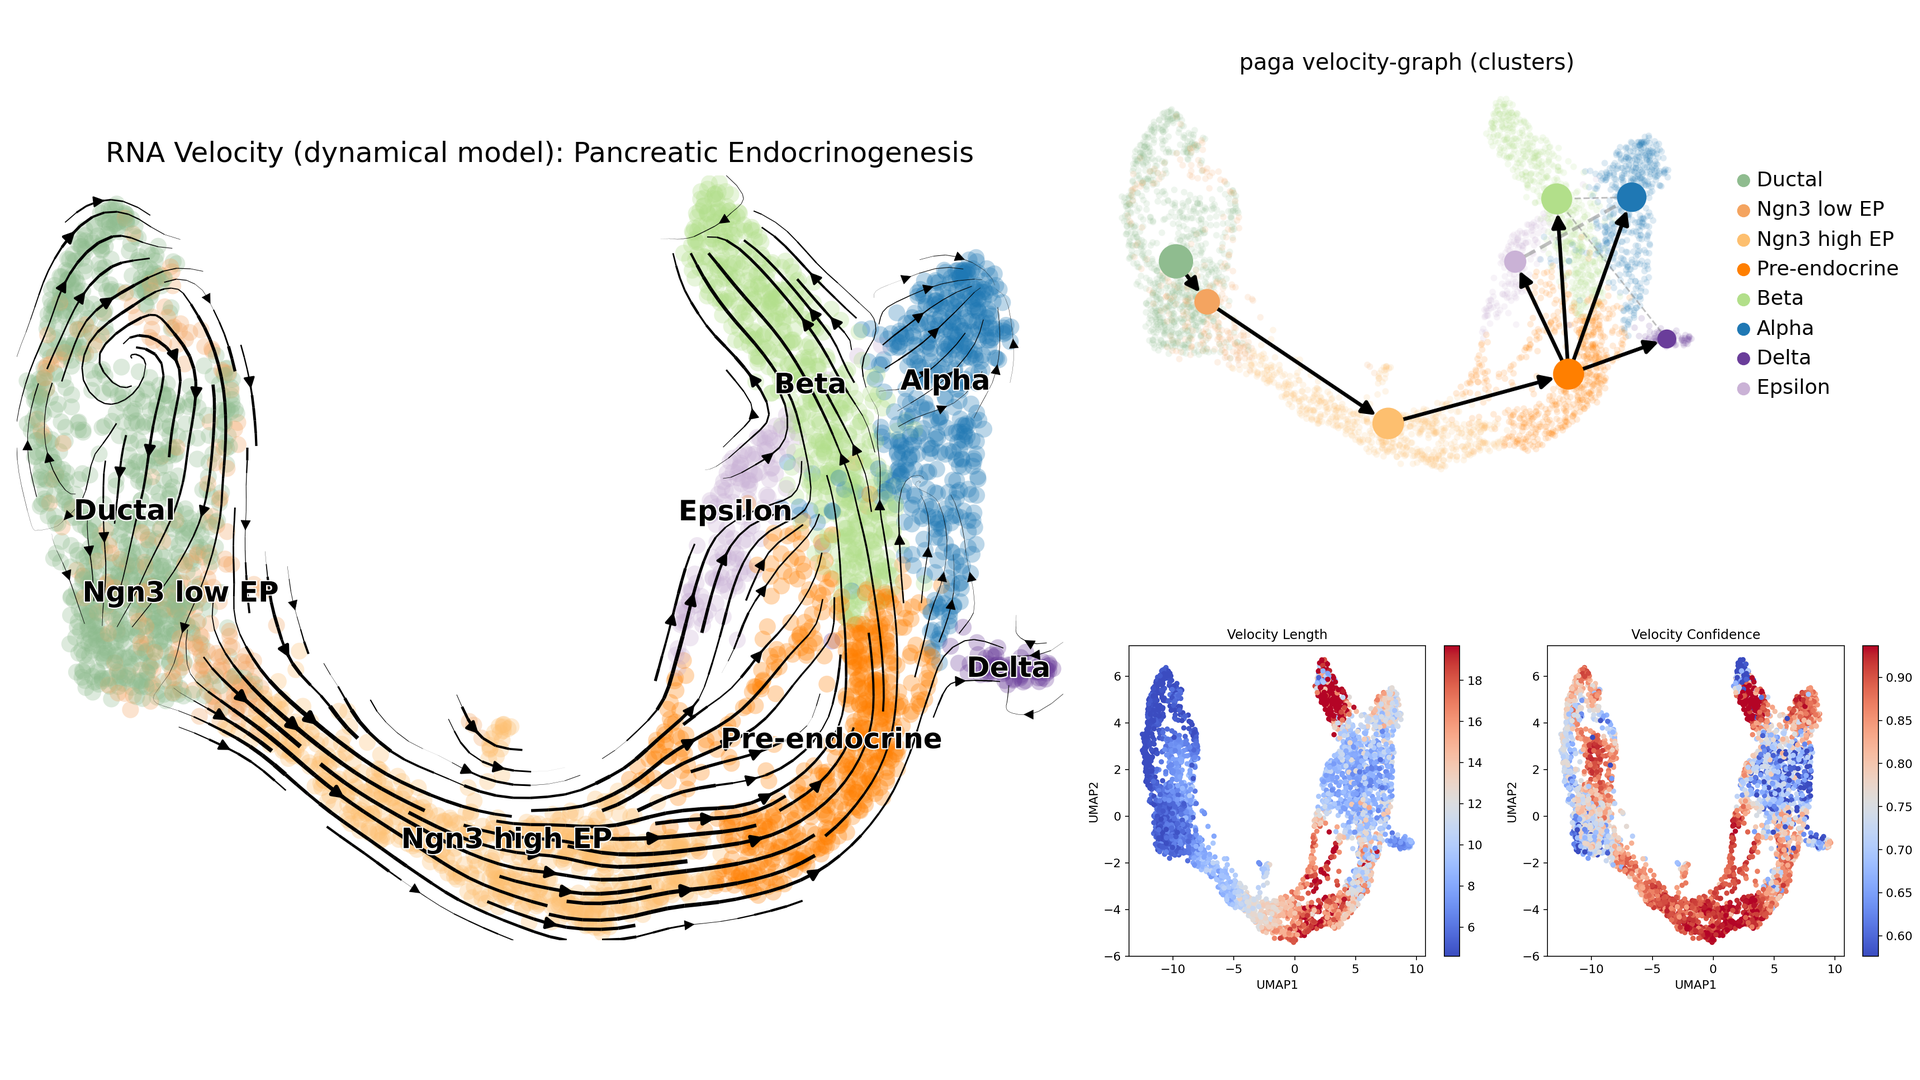
Project demonstration captures. Displayed material may be benchmark or demonstration data and is not clinical evidence.
METHODS REPRESENTED
UMAP visualisationCluster annotation reviewMarker-gene exploration
KNOWN LIMITATIONS
- Does not replace expert cell-type annotation
- Quality depends on upstream QC and integration
- AI-assisted labels require biological validation
USEFUL QUESTIONS
Before using the output.
Does it run the complete scRNA-seq pipeline?
The demonstrated interface focuses on exploration of prepared coordinates, annotations and expression tables.
Can cell types be accepted automatically?
No. Automated suggestions must be reviewed using marker evidence and biological context.