
Confirm file format and reference conventions
SPT / 011 · Spatial biology
Spatial Transcriptomics Atlas
A production-oriented research framework for spatial neighbourhoods and cell–cell communication across Visium, Xenium and MERFISH data.
SCIENTIFIC PURPOSE
Connects spatial coordinates, expression and tissue context for exploratory microenvironment analysis.
Who it helps
- Spatial biology teams
- Cancer microenvironment researchers
- Translational laboratories
Supported inputs
- Supported spatial-omics dataset
- Tissue coordinates
- Cell or spot annotations
Useful outputs
- Spatial neighbourhood maps
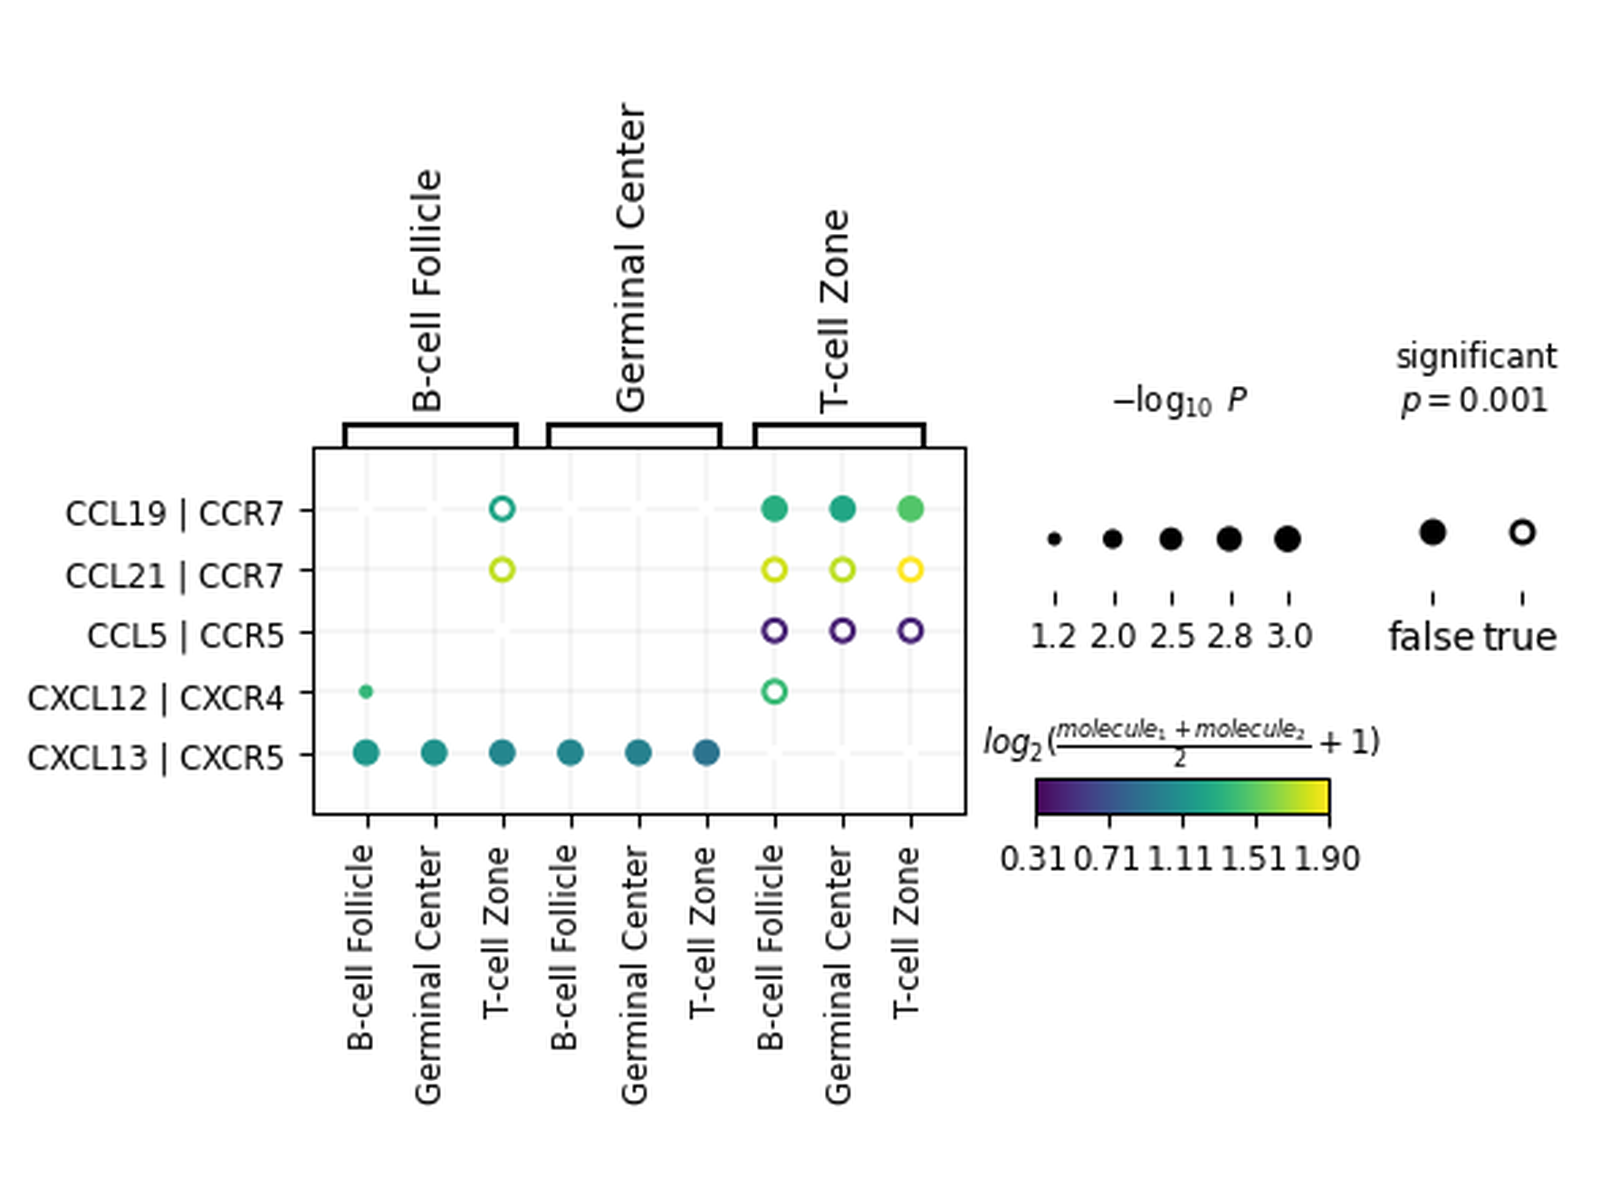
- Ligand–receptor exploration
- WebGL overlays
PROJECT INTELLIGENCE
A structured view of
scope and evidence.
These figures describe the documented public surface—not biological performance, clinical validity or benchmark superiority.
SPT / 011Research project
SquidpySpatial graphsLigand–receptor analysisDATA CONTRACT
What enters, what happens,
what leaves.
01 / INPUT
Supported spatial-omics dataset
Tissue coordinates
Cell or spot annotations
02 / ANALYSIS
01Load spatial dataset
02Perform quality review
03Explore neighbourhoods
04Evaluate communication hypotheses
05Export spatial figures
03 / OUTPUT
Spatial neighbourhood maps
Ligand–receptor exploration
WebGL overlays
EVIDENCE & INTERPRETATION MATRIX
How to use the project responsibly.
DimensionPublic evidenceInterpretation boundary
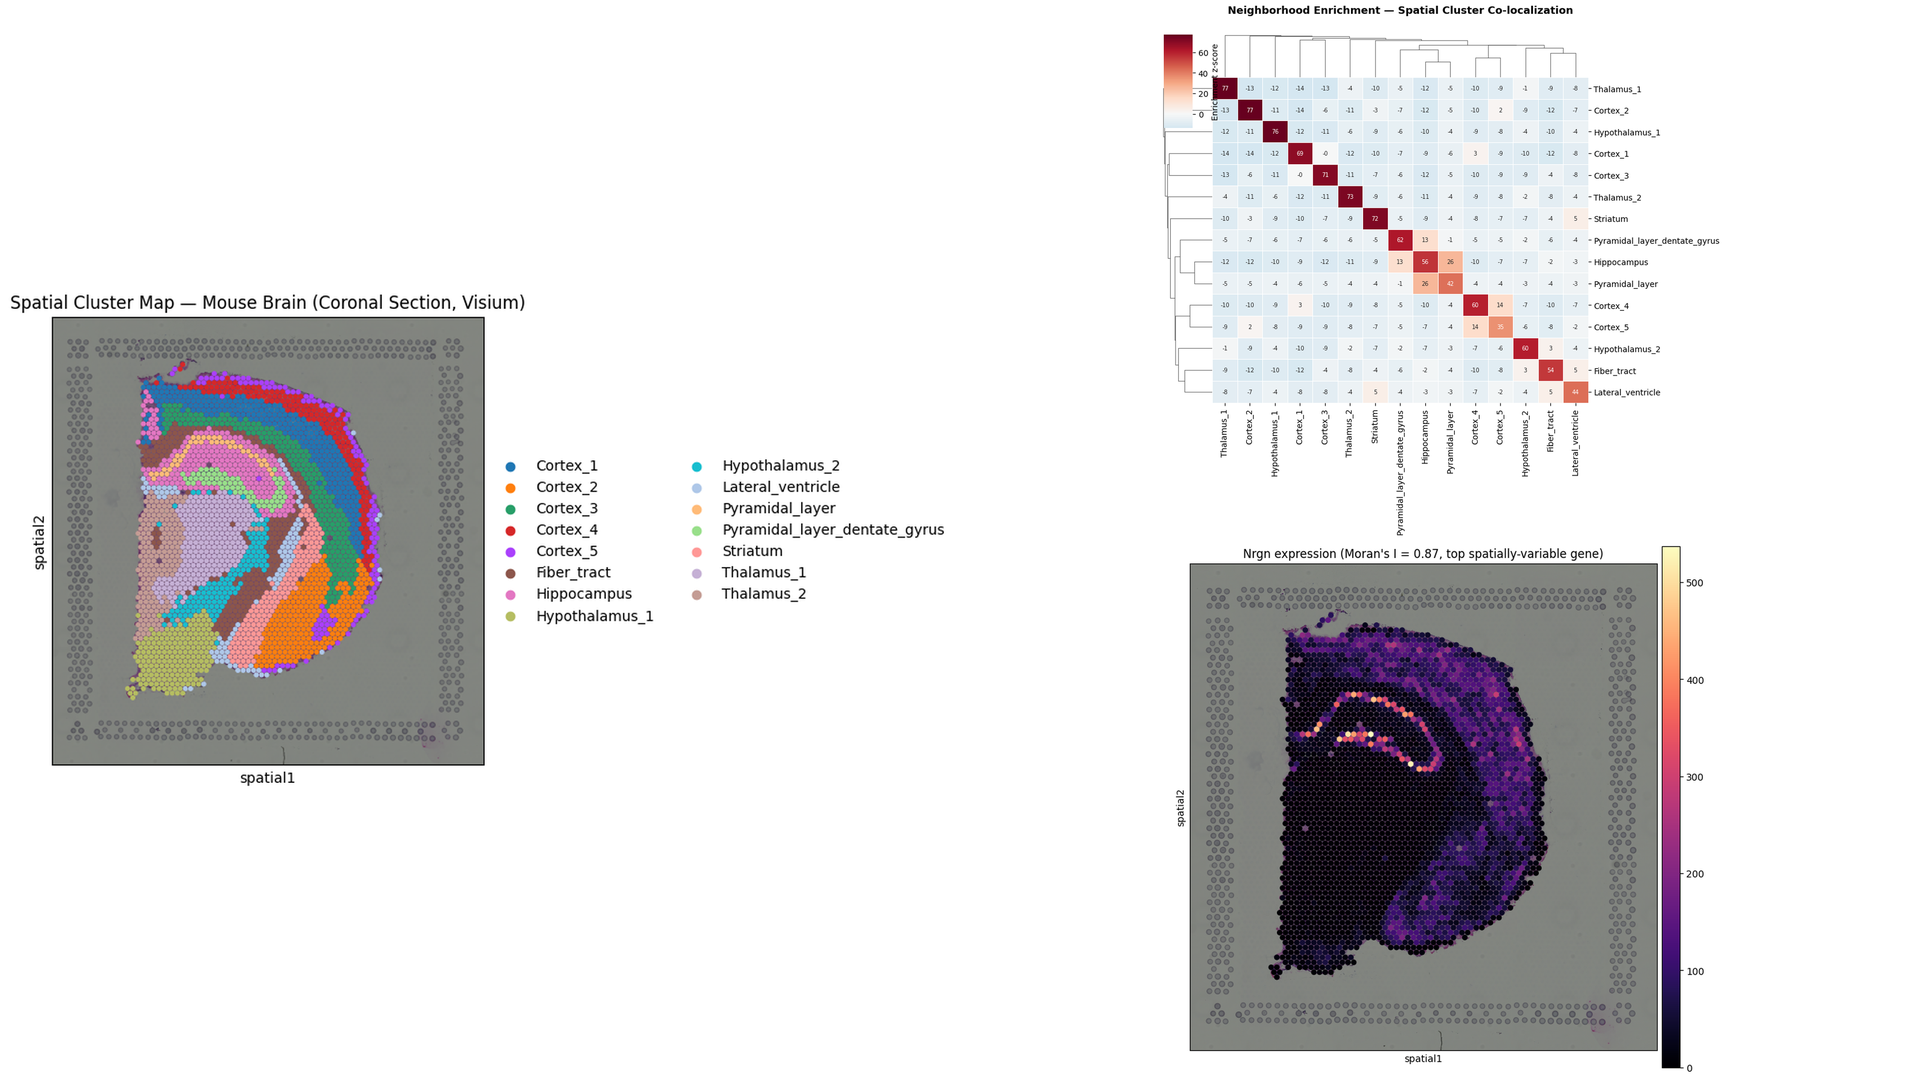
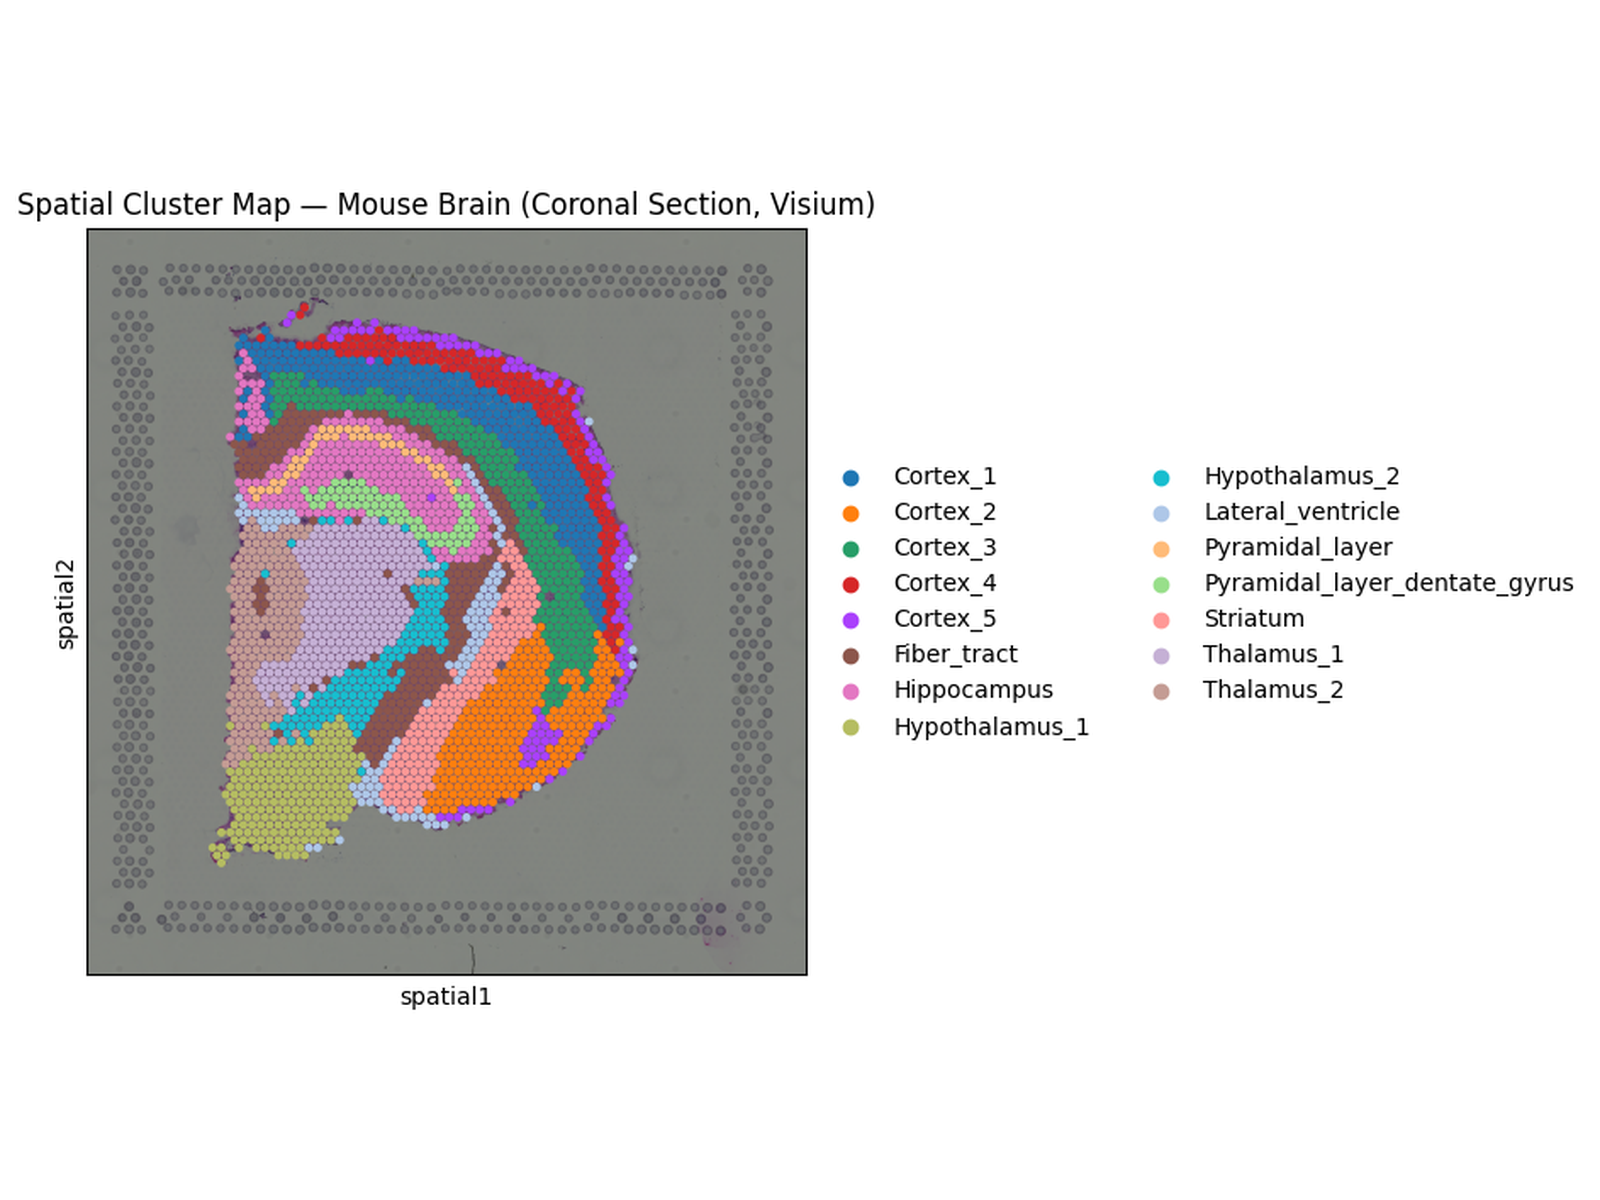
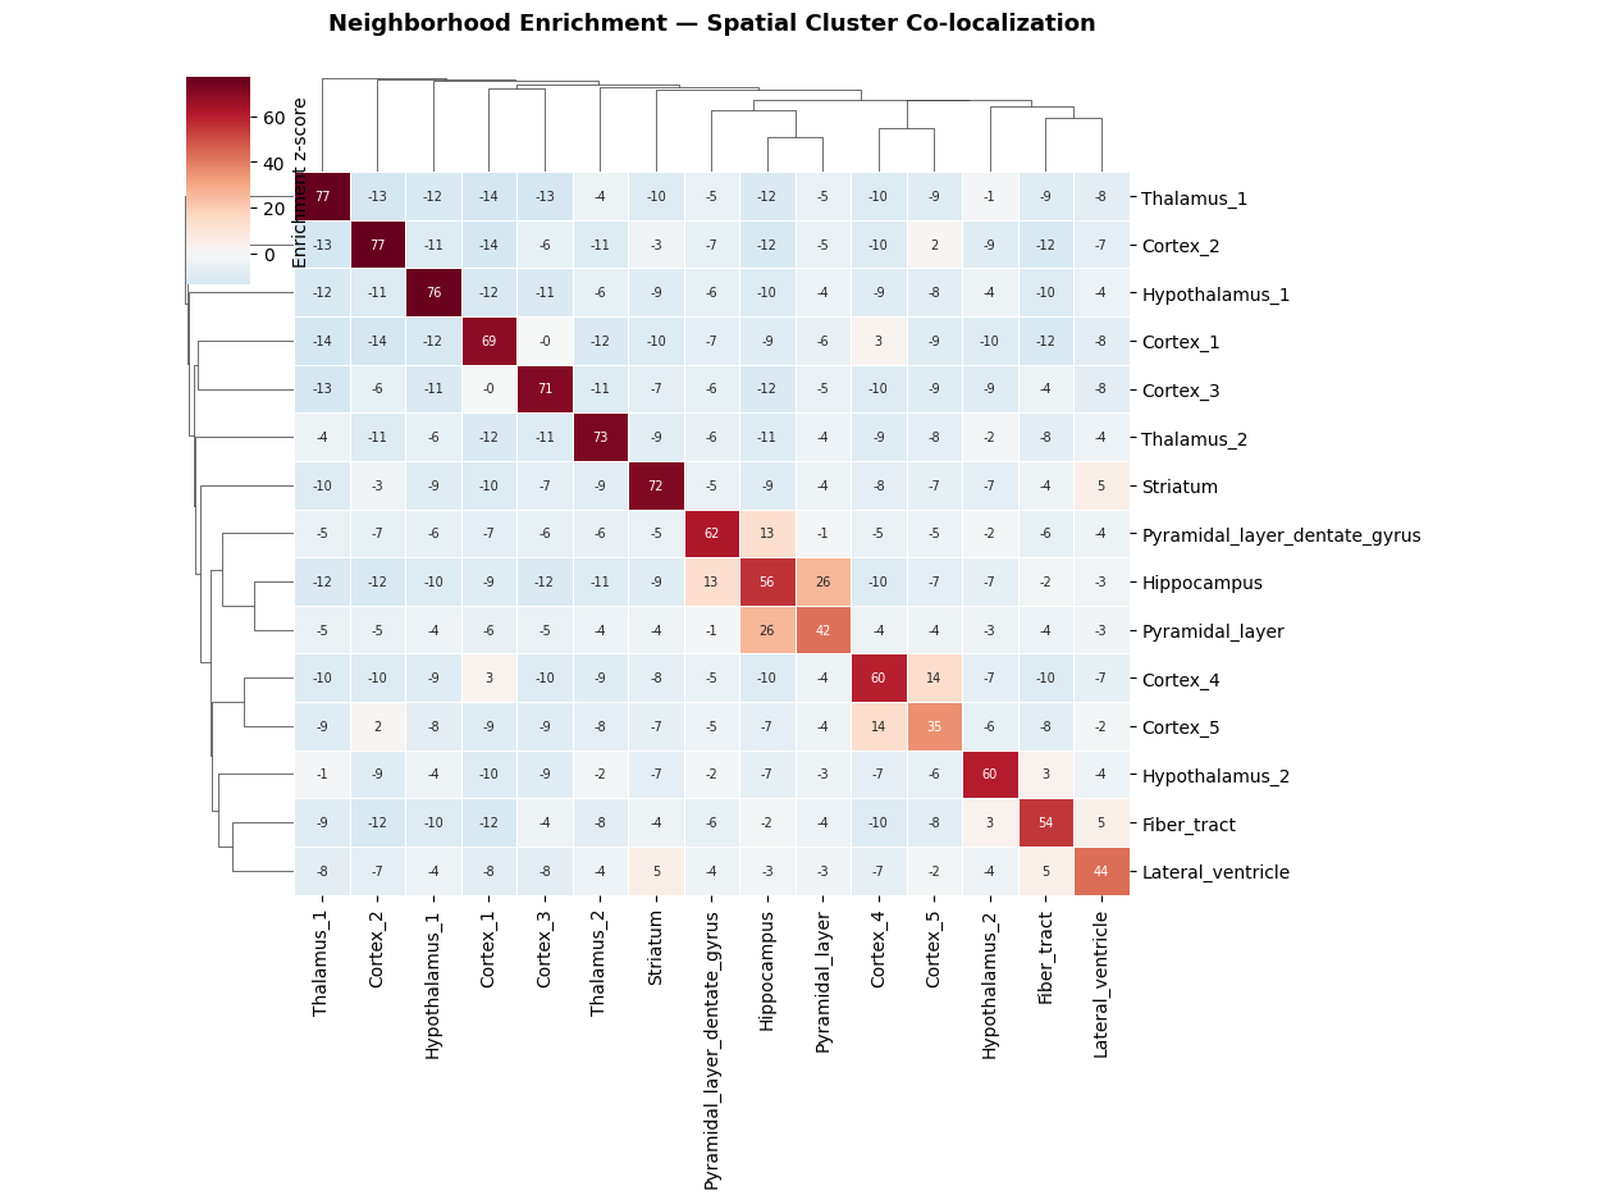
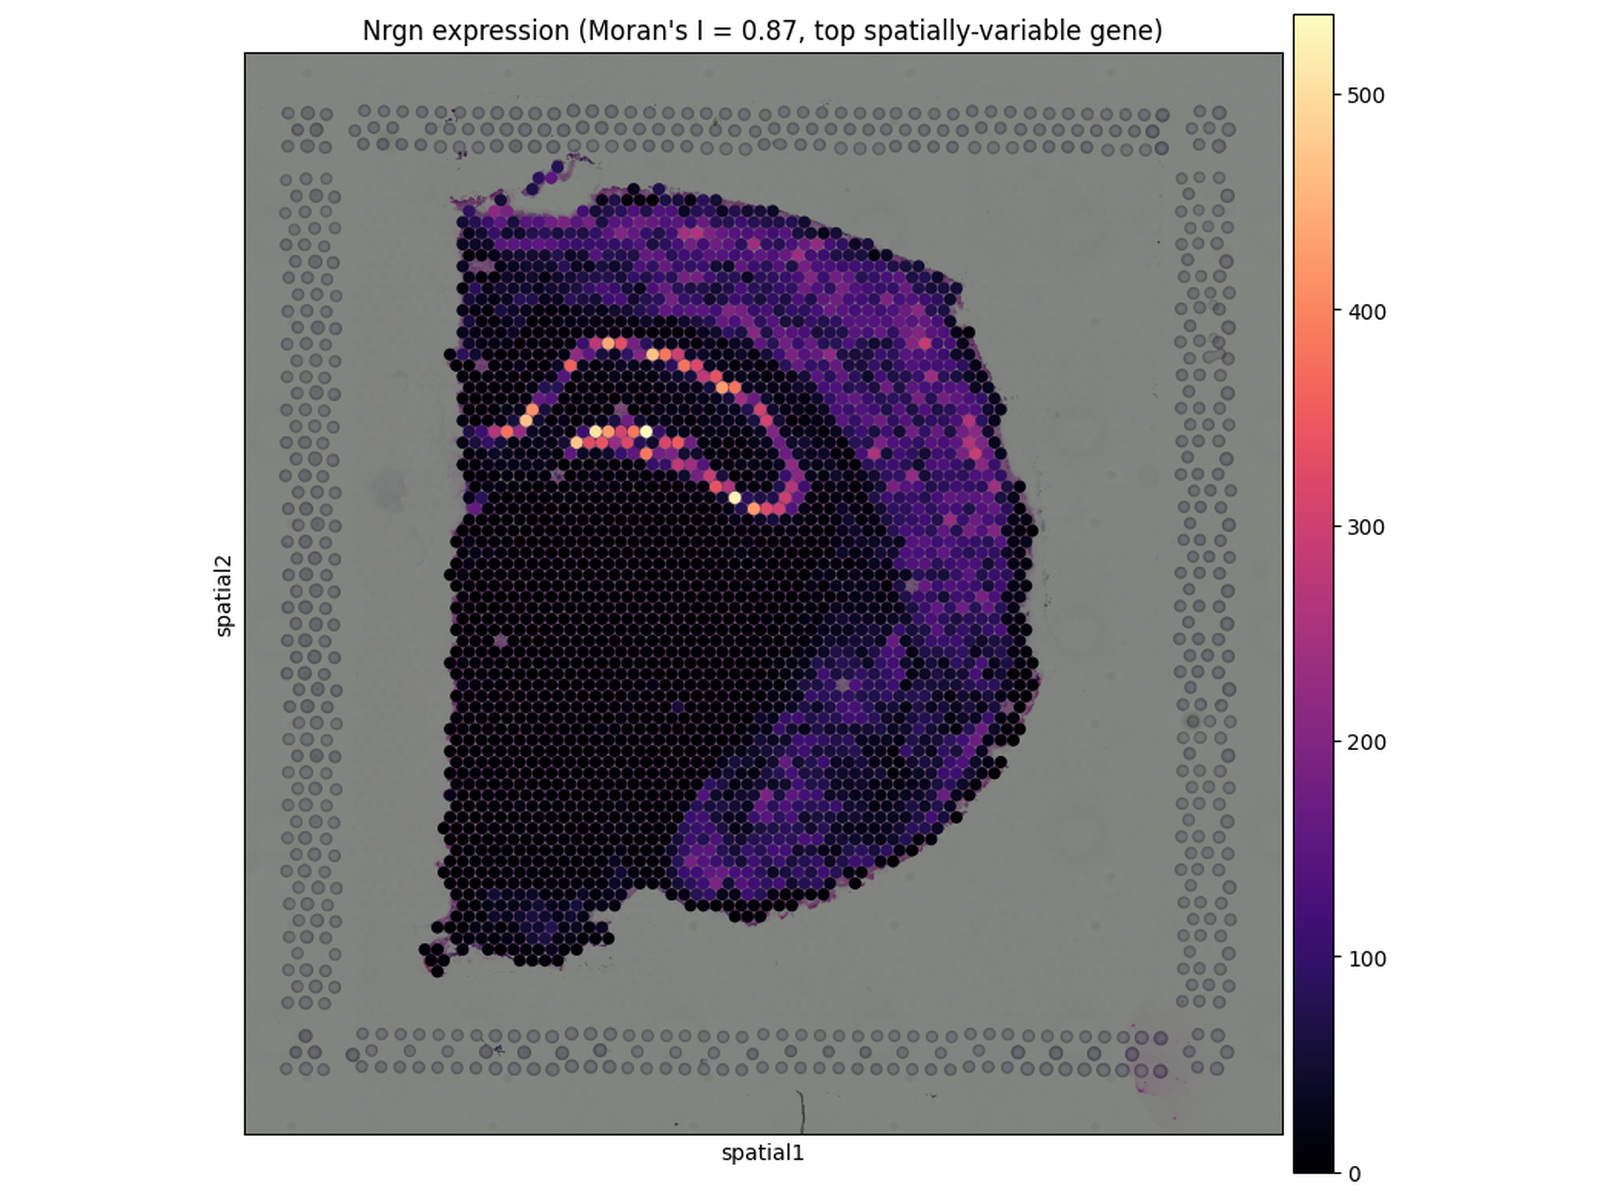
Interface12 documented viewsScreenshots demonstrate interaction patterns, not scientific validation.
MethodsSquidpy · Spatial graphs · Ligand–receptor analysisMethod presence does not establish suitability for every dataset.
ReproducibilityDefined inputs, stages and outputsVersions, parameters and data provenance must accompany a real analysis.
Scientific useResearch exploration and communicationNo medical, diagnostic or treatment conclusion is produced.
BEFORE INTERPRETATION
Record tool, database and dataset versions
Inspect missing values, outliers and sample labels
Review assumptions behind each selected method
Keep exported figures linked to their source data
Request domain-expert review for consequential claims
TYPICAL RESEARCH FLOW
- 01
Load spatial dataset
- 02
Perform quality review
- 03
Explore neighbourhoods
- 04
Evaluate communication hypotheses
- 05
Export spatial figures
INTERFACE GALLERY
Multiple views,
one research task.
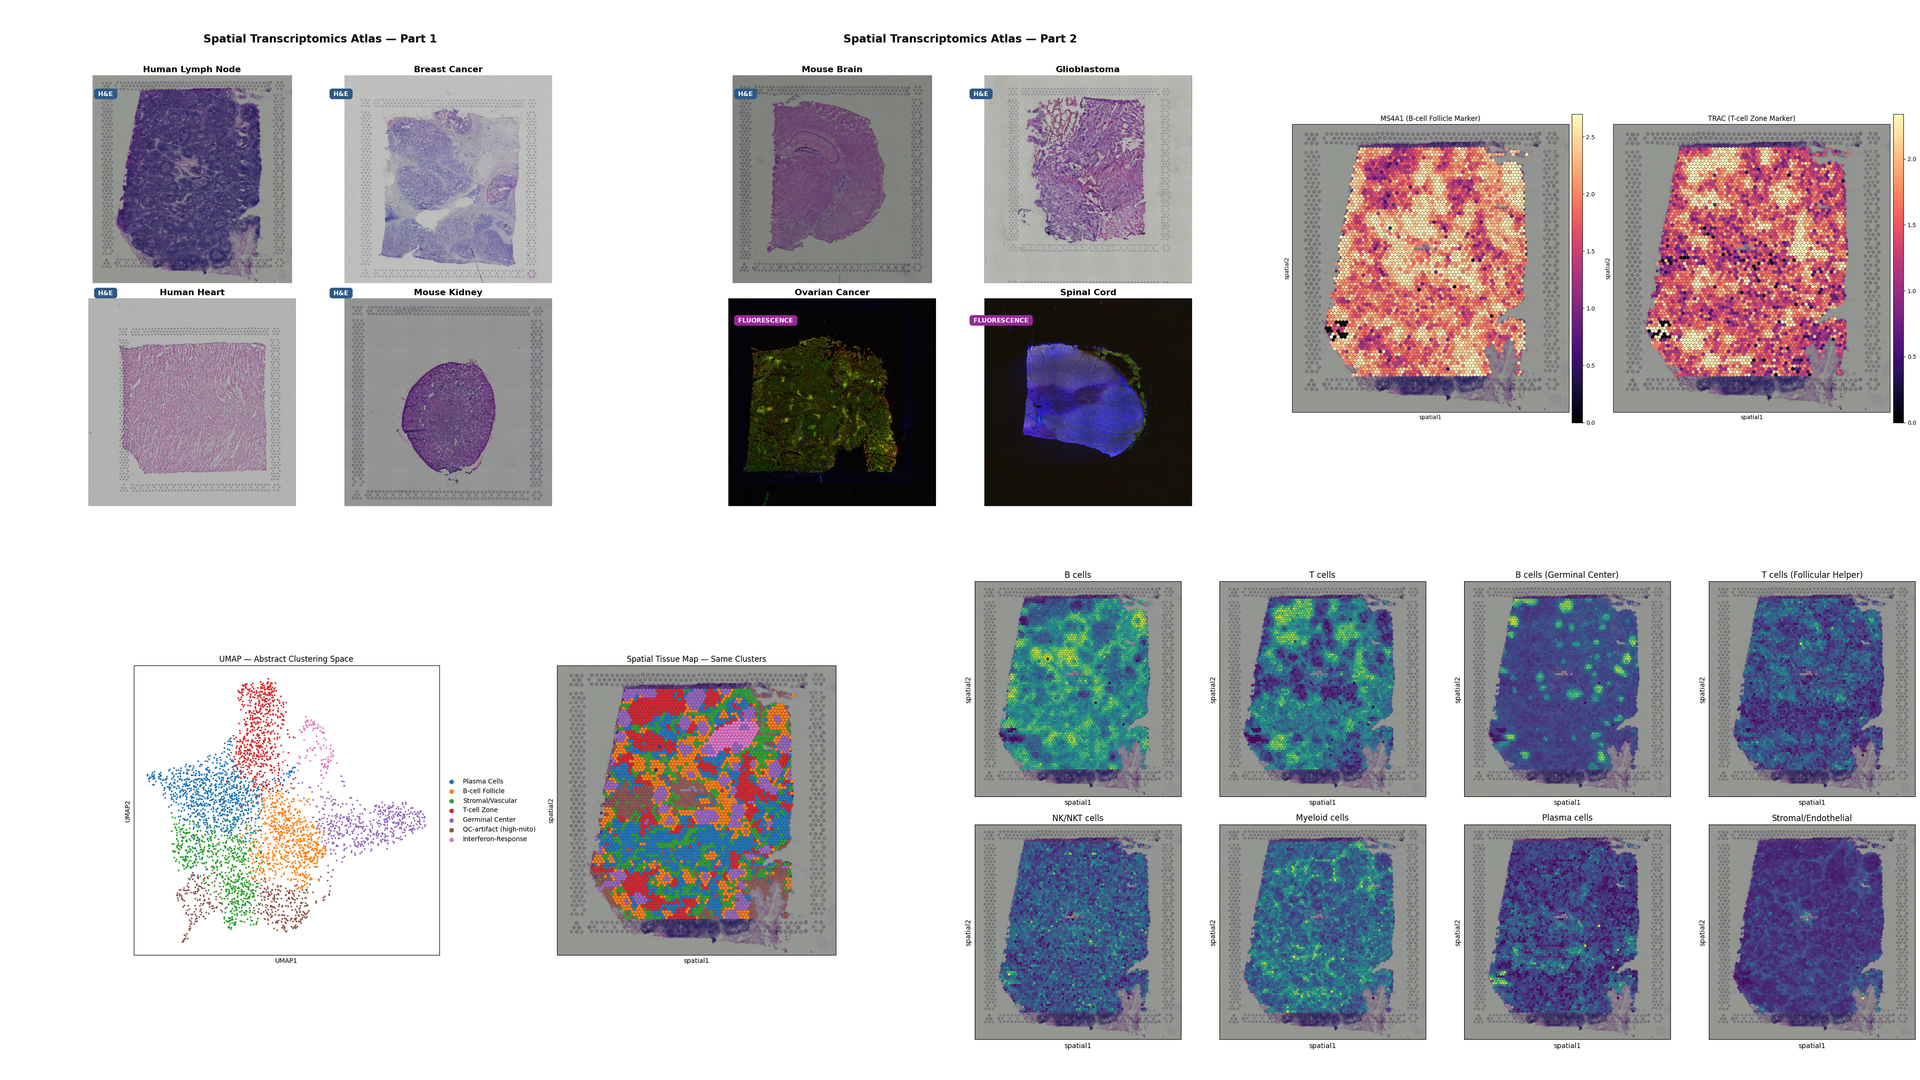
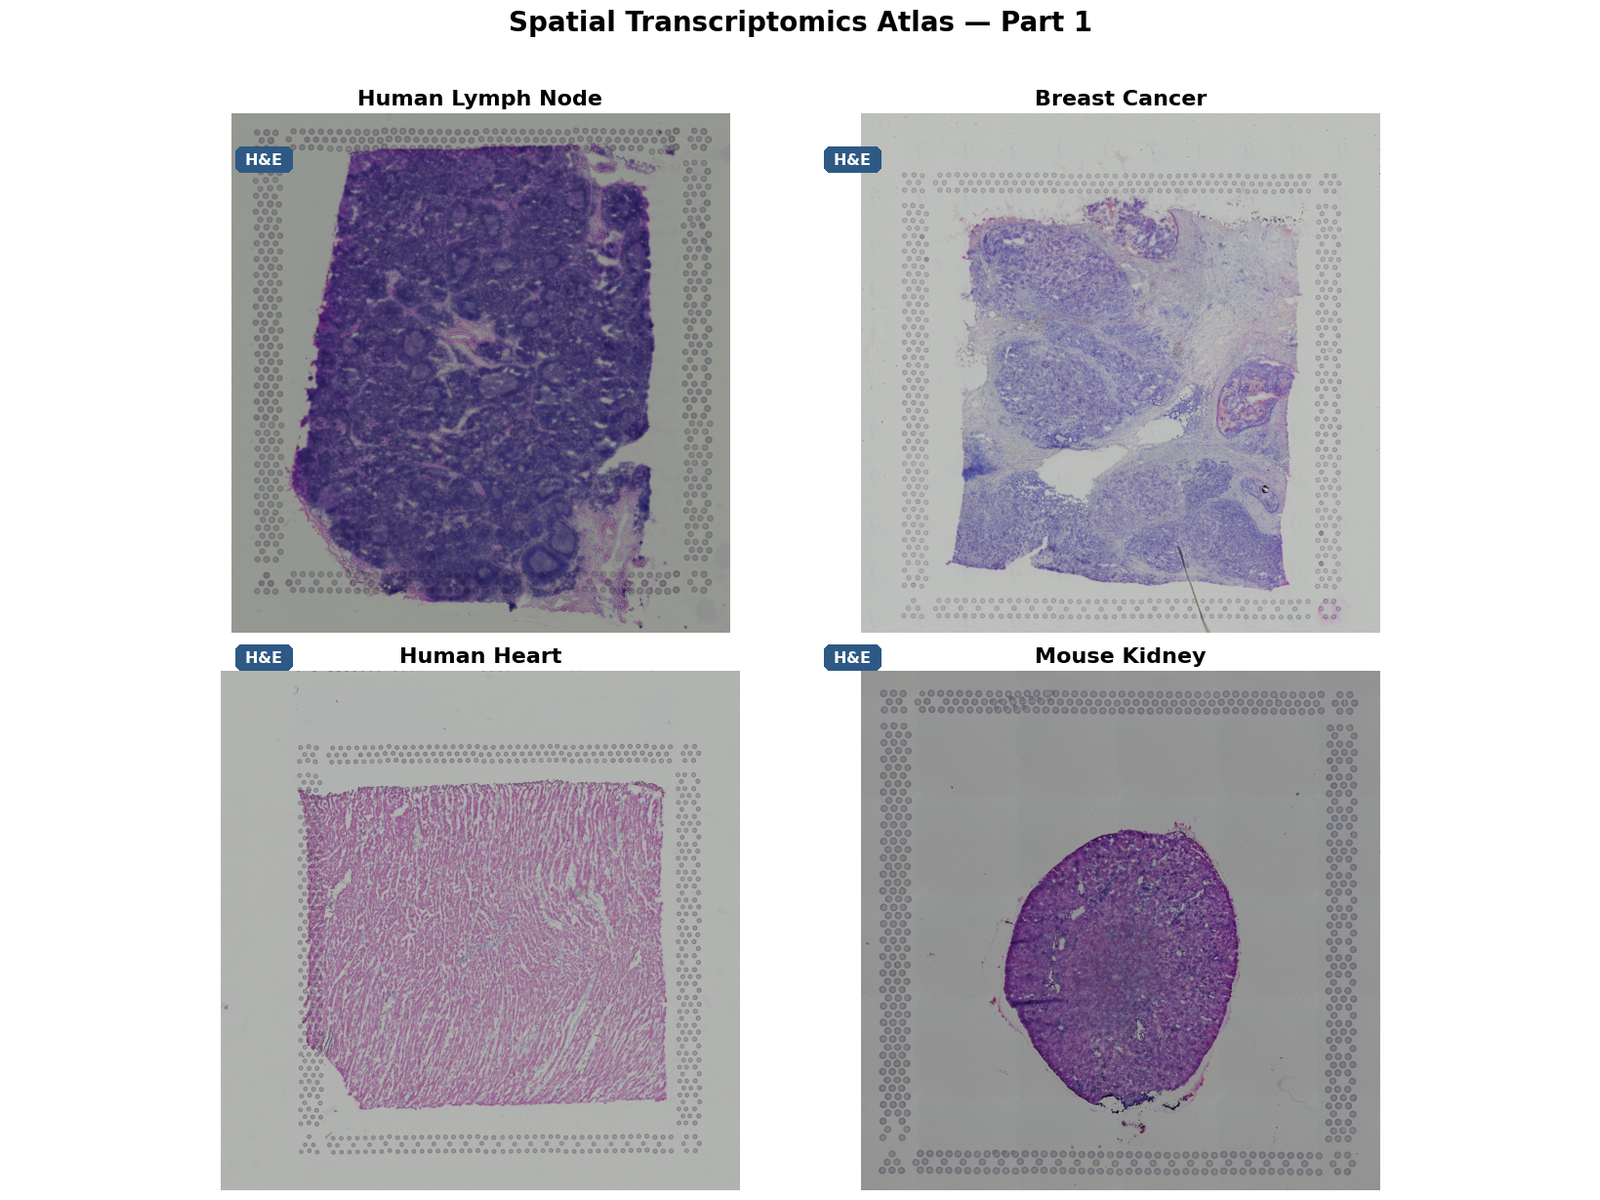
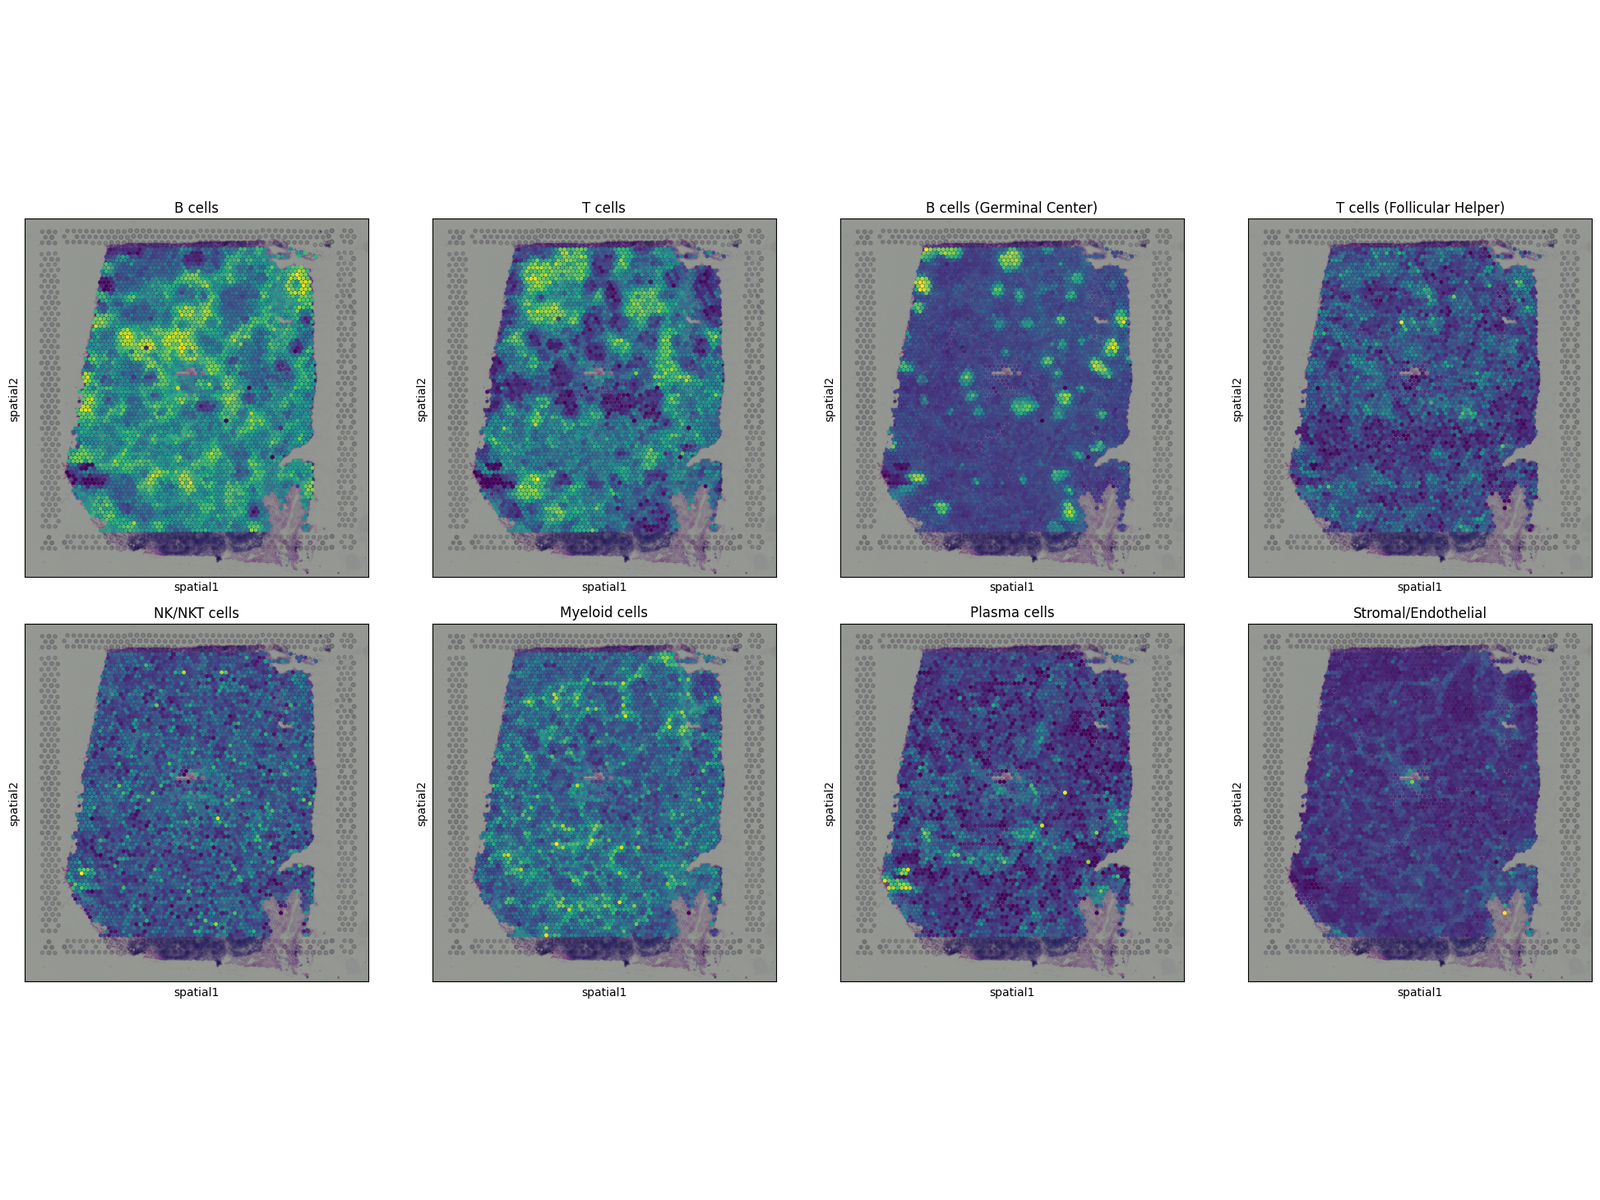
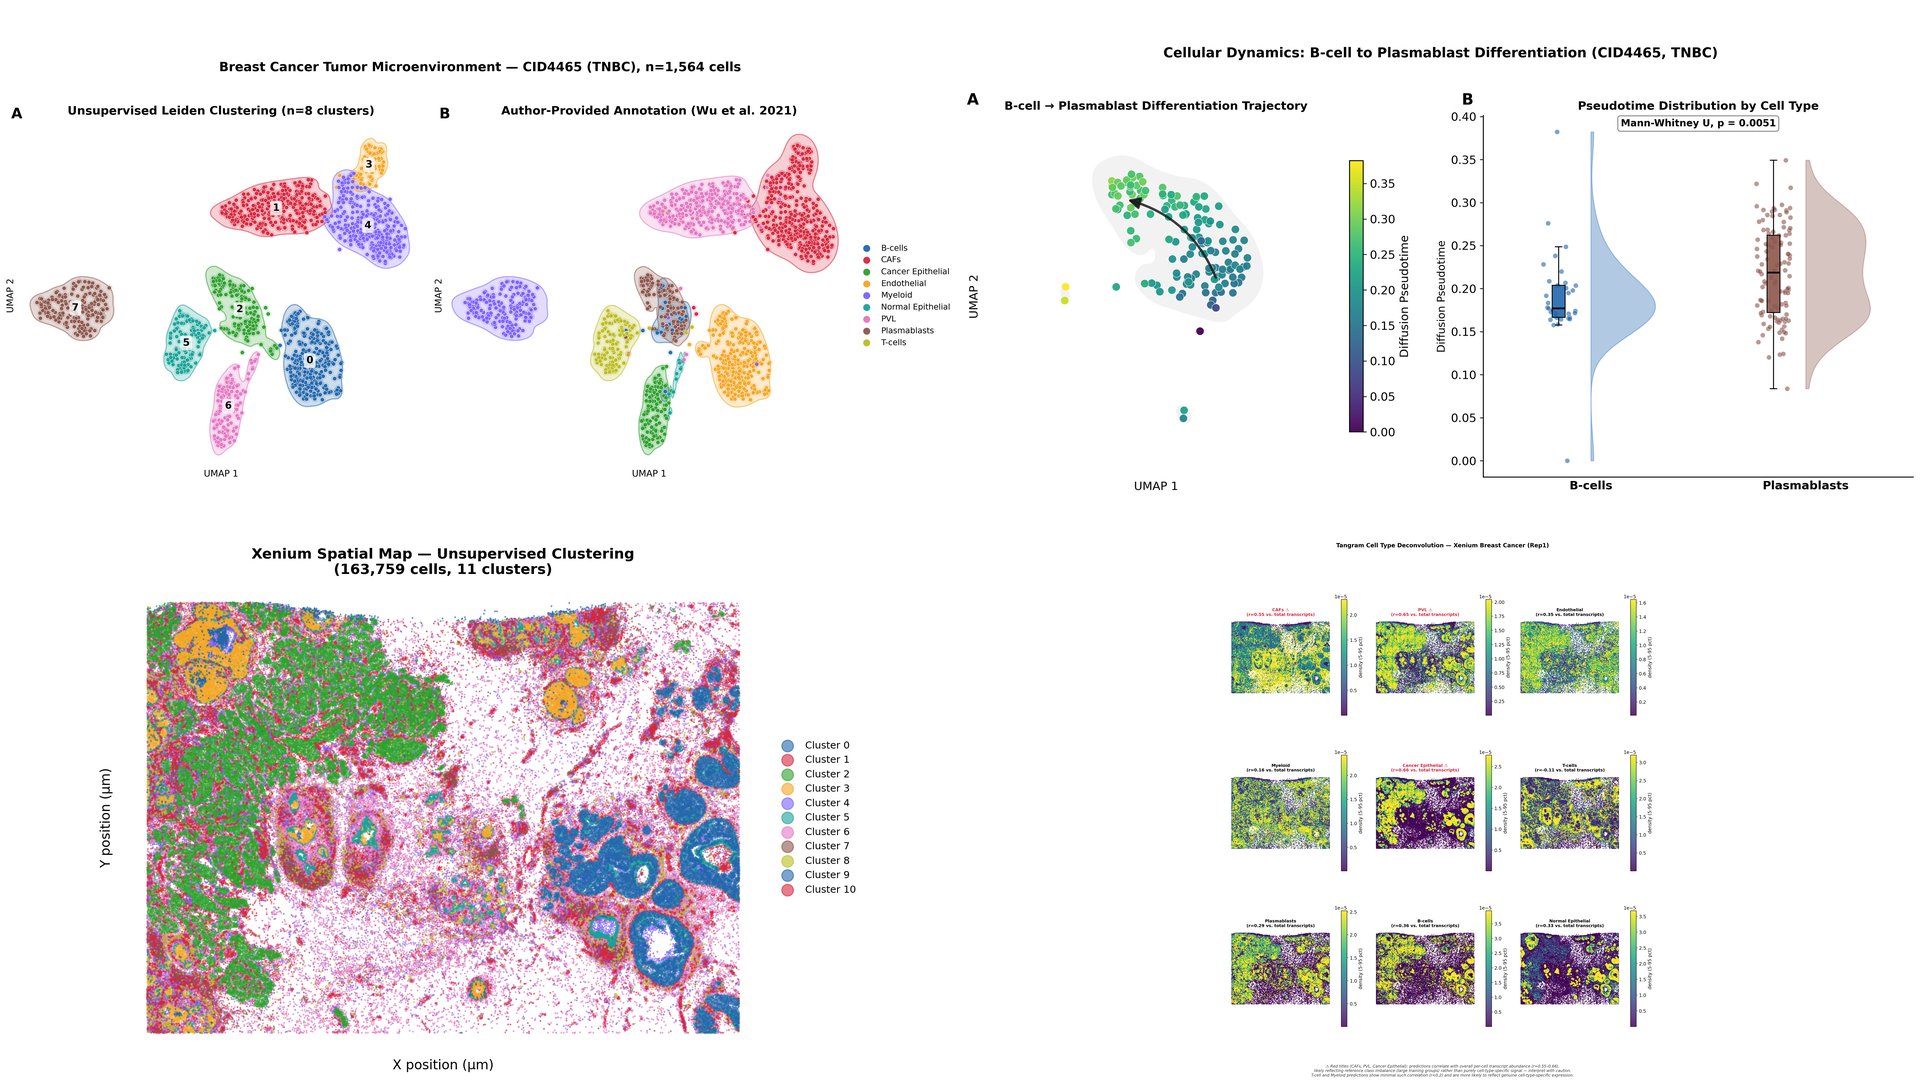
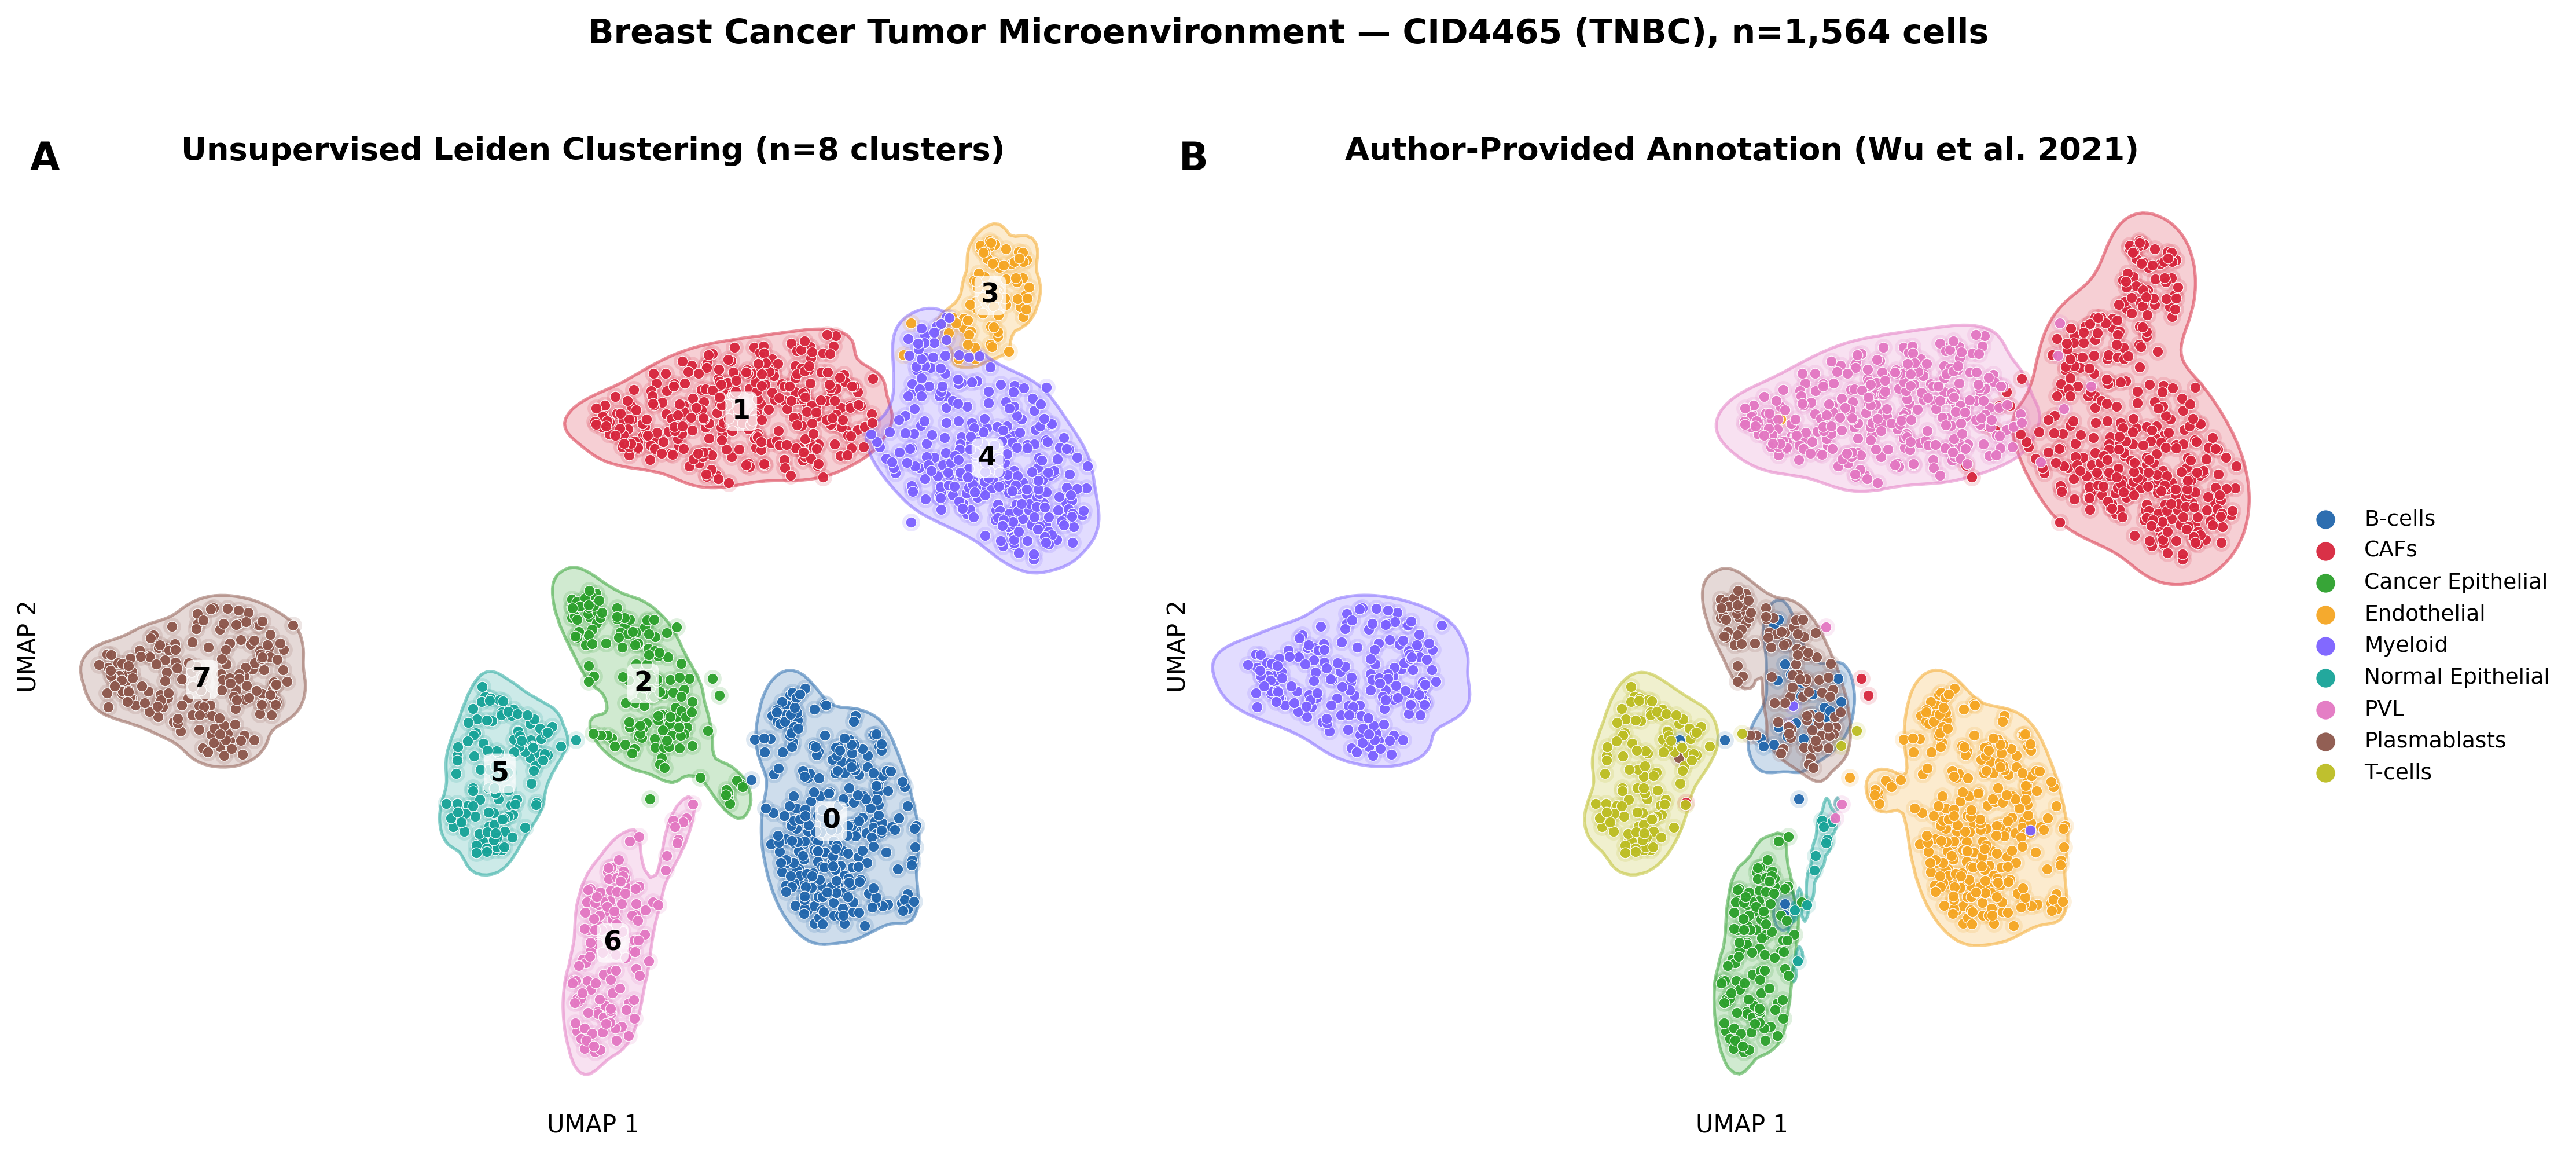
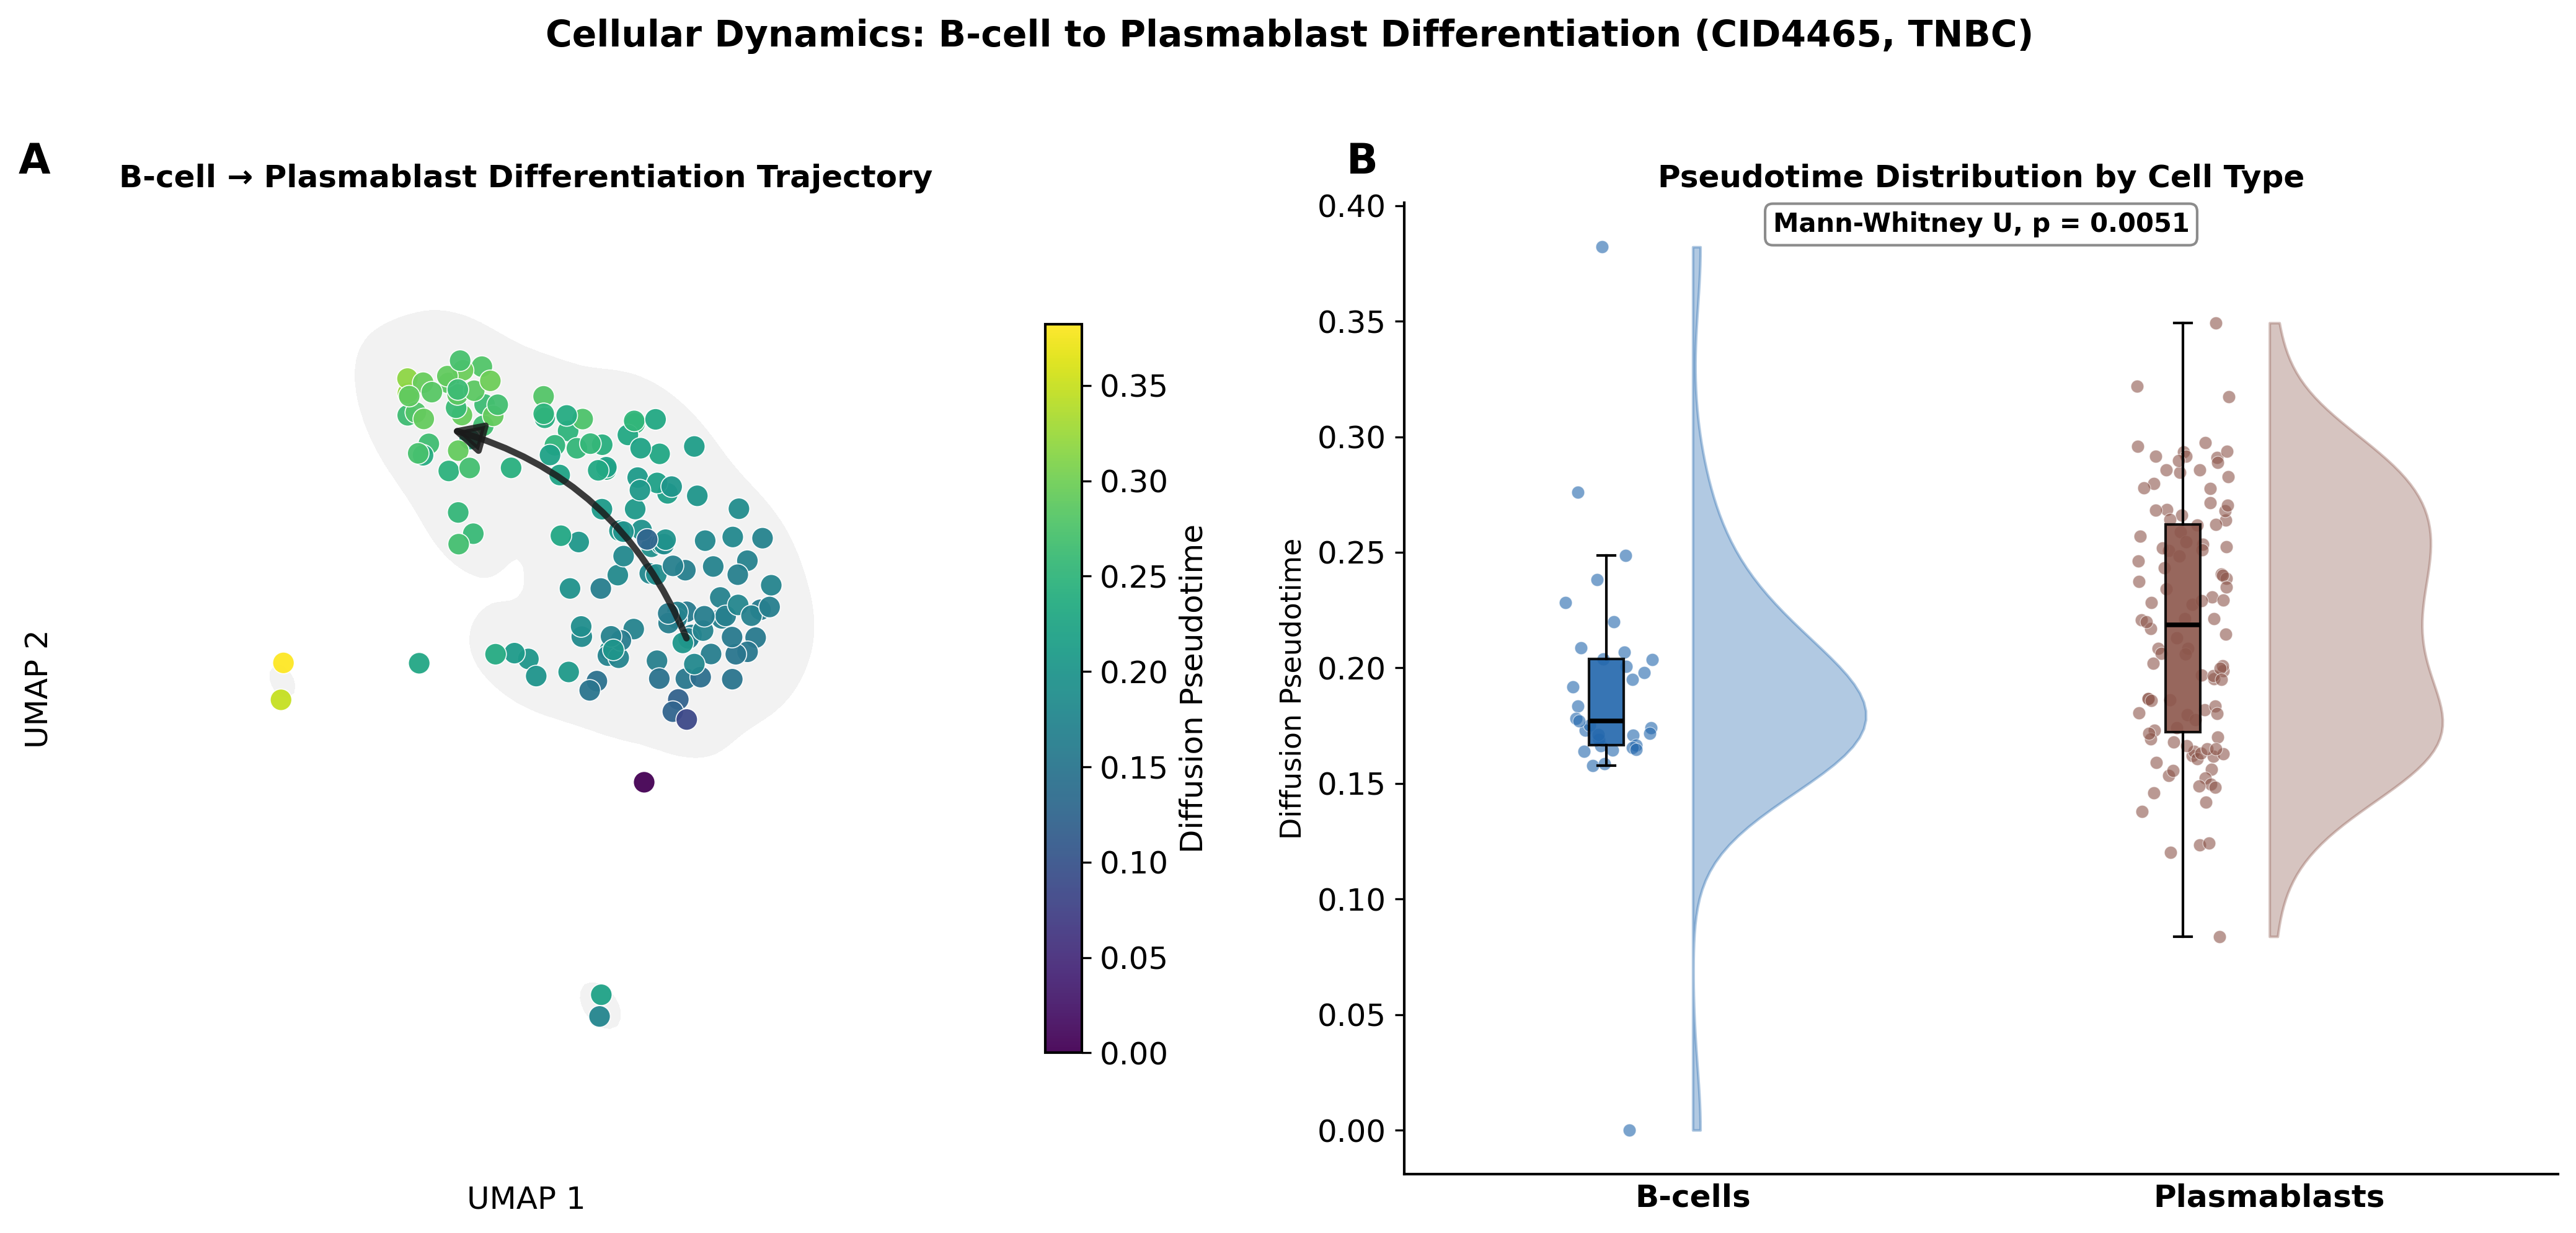
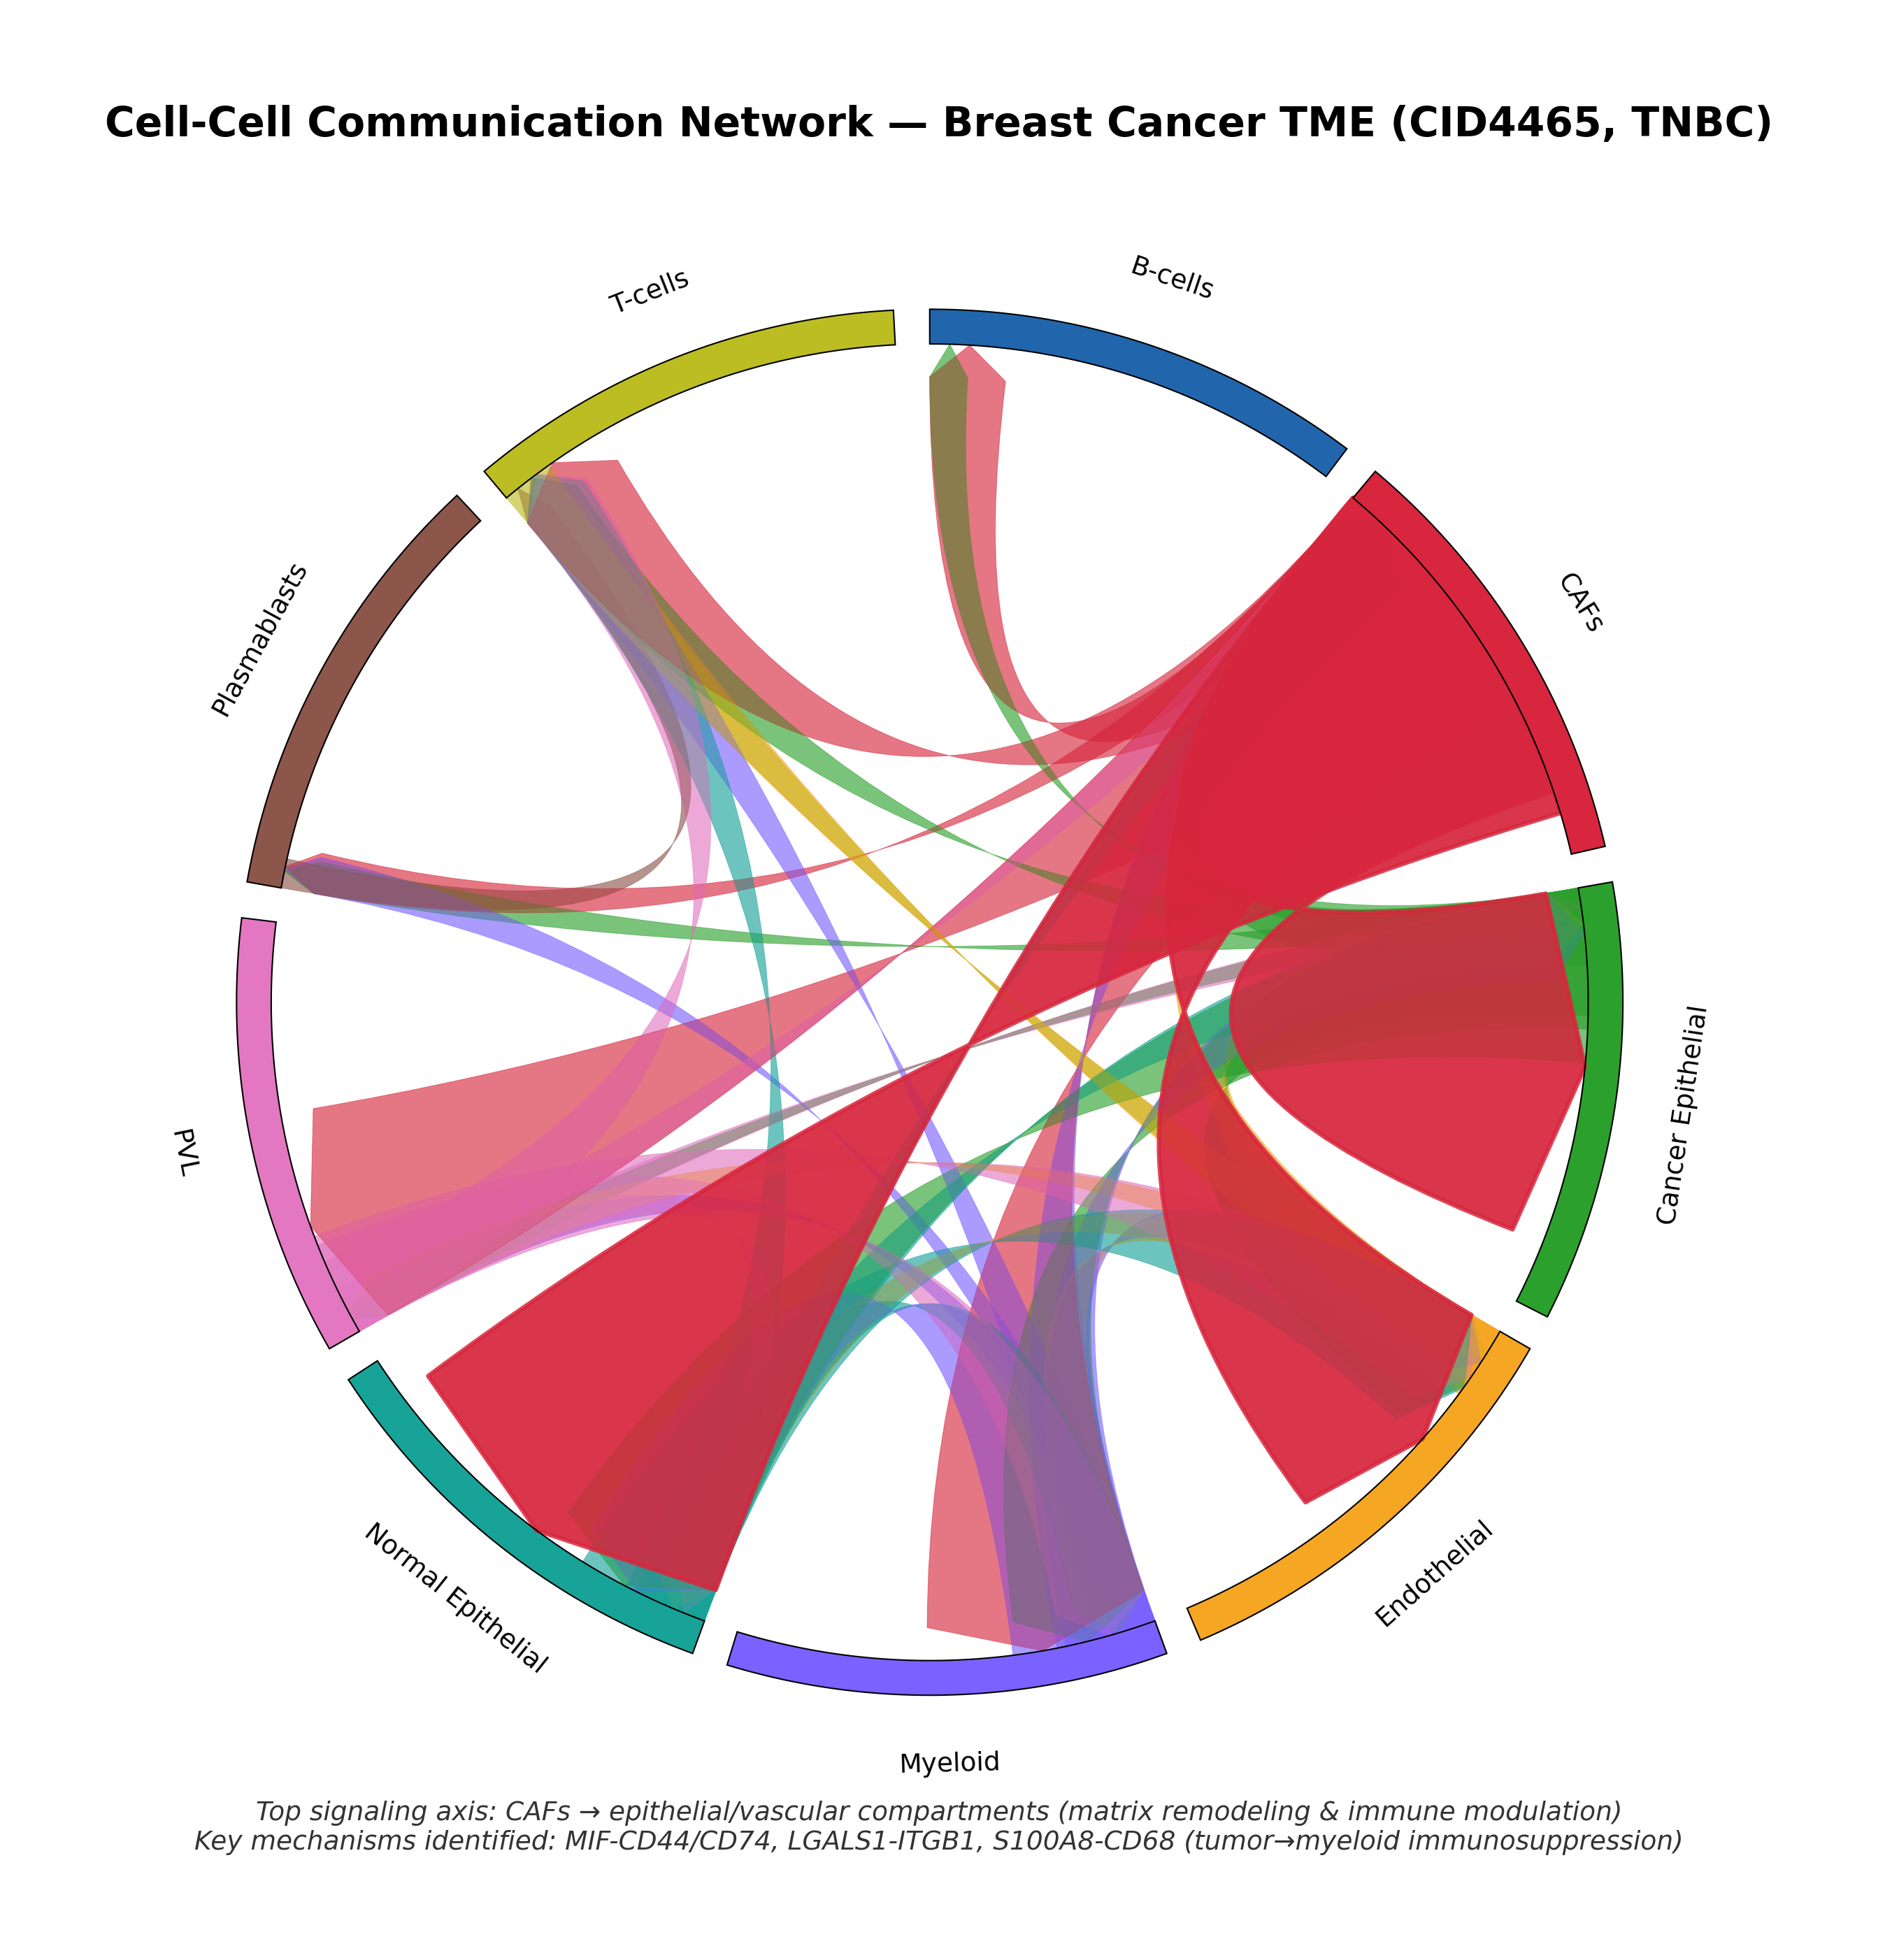
Project demonstration captures. Displayed material may be benchmark or demonstration data and is not clinical evidence.
METHODS REPRESENTED
SquidpySpatial graphsLigand–receptor analysis
KNOWN LIMITATIONS
- Research stage
- Platform-specific preprocessing remains necessary
- Communication scores are hypothesis-generating
USEFUL QUESTIONS
Before using the output.
Which platforms are in scope?
The public project description covers 10x Visium, Xenium and MERFISH-oriented workflows.